RePEcEconometrics & Forecasting
Price Conflict and US Stock Return Volatility Forecasting: Insights from over 150 Years with a Mixed-Frequency Framework
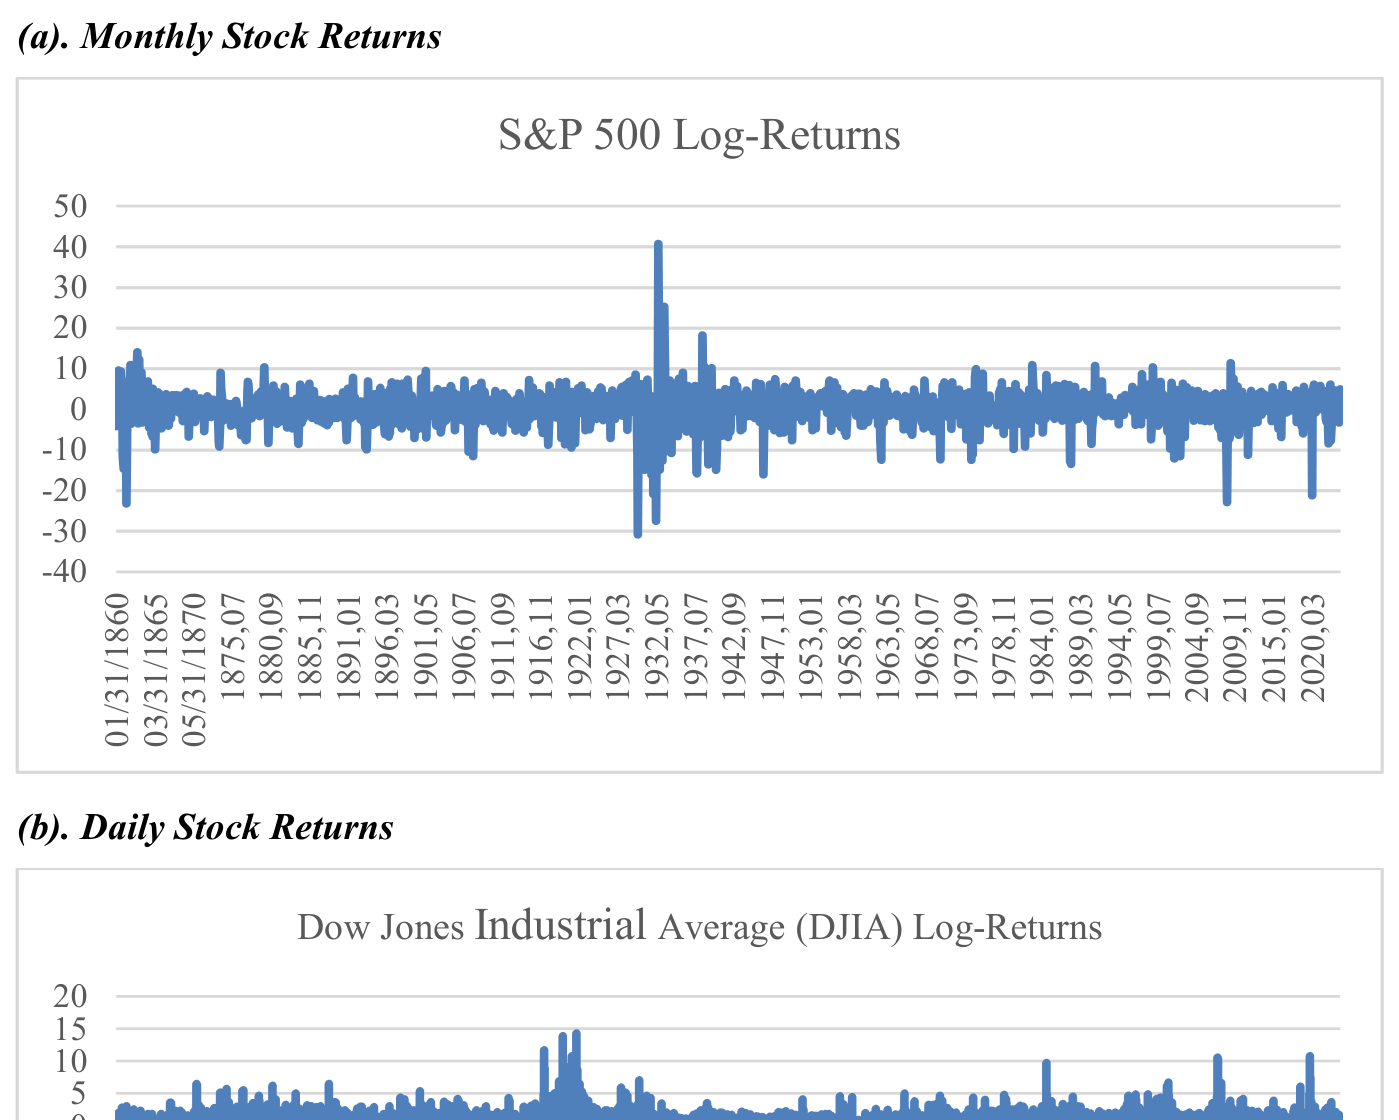
The GARCH-MIDAS model incorporating a quarterly news-based Price Conflict Index outperforms benchmarks for forecasting US stock volatility over 150 years of monthly and daily data.
Featured in No. 133 on 2 Oct 2026 · 9 days after release
- Released
- 23 Sep 2026
- First featured
- No. 133 · 2 Oct 2026
- Published in
- Not yet, as far as Semantic Scholar knows
- Fanfare
- 2 of 5
- Identifier
- RePEc:pre:wpaper:202620
- Authors
- Afees A. Salisu et al.
Citations and venue from Semantic Scholar (ODC-BY), refreshed weekly. Summary: Quant Letter (CC BY 4.0).