Superstar Returns? Spatial Heterogeneity in Returns to Housing
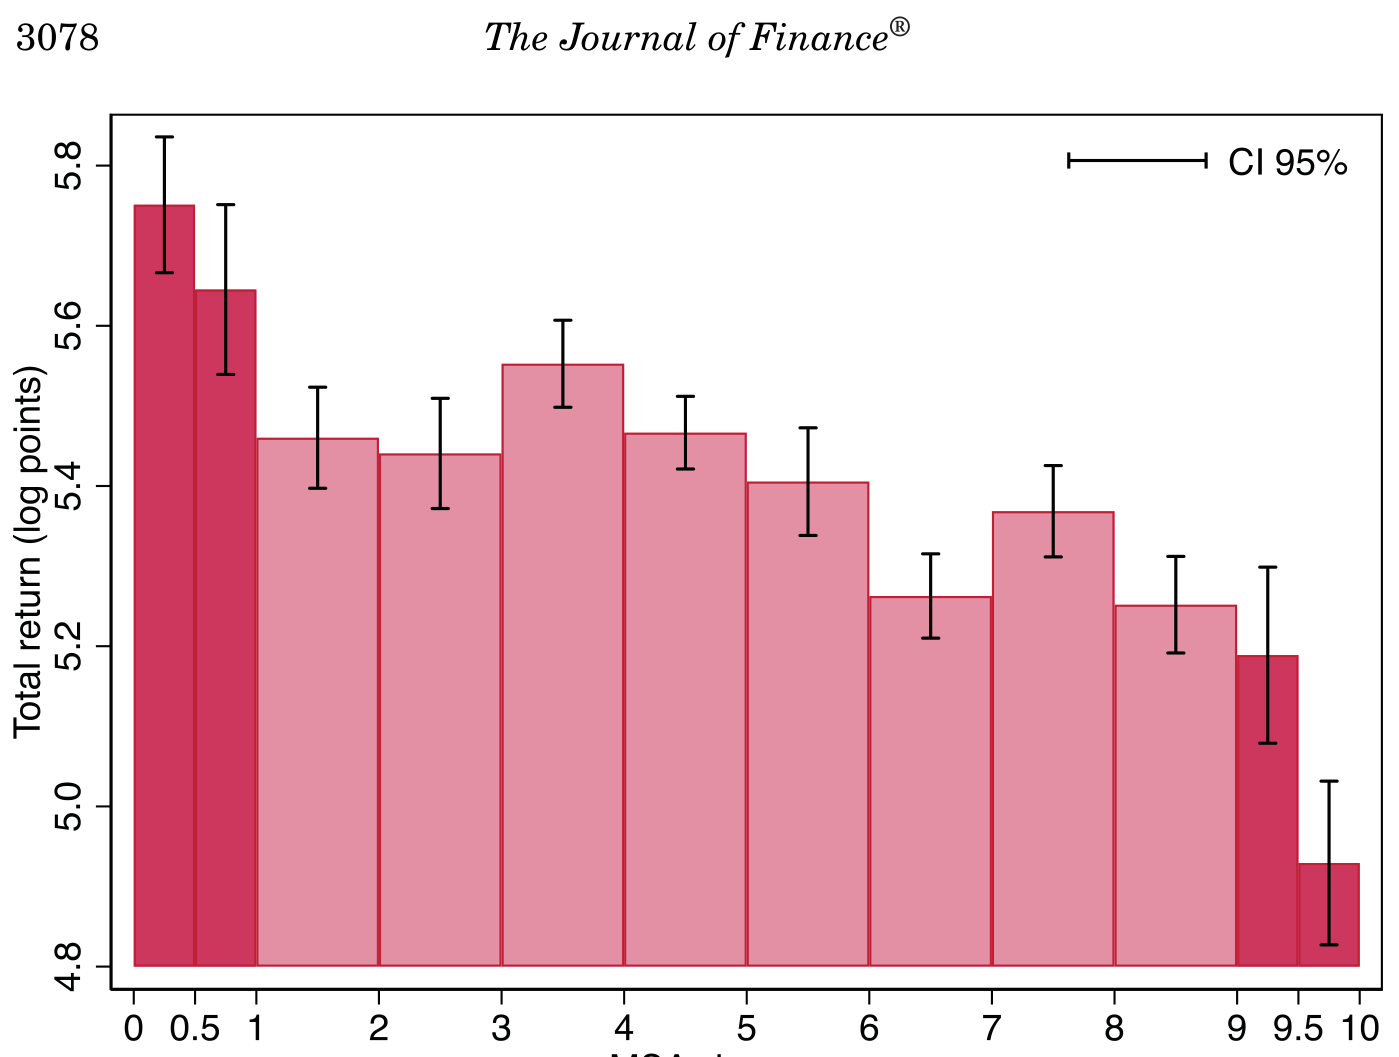
Analysis of 15 OECD countries over 150 years finds total returns in large agglomerations are about 100 basis points lower annually than elsewhere, explained by income covariance and liquidity differences.
Featured in No. 140 on 20 Nov 2026 · 4 days after release
- Released
- 16 Nov 2026
- First featured
- No. 140 · 20 Nov 2026
- Published in
- Not yet, as far as Semantic Scholar knows
- Fanfare
- 3 of 5
- Identifier
- RePEc:zbw:ifwkie:329807
- Authors
- Francisco Amaral et al.
Citations and venue from Semantic Scholar (ODC-BY), refreshed weekly. Summary: Quant Letter (CC BY 4.0).