ML-QuantSubscribe

Quant Letter

November 2026, Week 3

The week in quantitative finance research: 90 papers from arXiv, SSRN and RePEc, screened and ranked, 14–20 Nov 2026.

Papers
90
New this week
90
With figures
53
High fanfare
13

From the editor

This week balances sobering findings on research reproducibility and AI trading limitations with structural insights on market microstructure and macro predictors. AI Multiverse Analysis documents severe specification dependence across published papers, while LLM traders generate only beta. Dealer Gamma Momentum and Treasury-to-Equity Ratio emerge as strong daily and annual return predictors respectively.

Top picks

If you read five papers this week, read these.

  1. AI Multiverse Analysis of Finance Research

    An AI-powered replication of 324 papers reusing natural experiments finds only 25% of defensible specifications preserve published sign and significance, quantifying dependence on analysis choices.

    Fanfare 4ML & AI Methods
    Paper characteristics and the outcomes, one characteristic at a time
  2. The ratio of Treasury debt to equity market value predicts one-year stock returns with 15.8% in-sample and 16.7% out-of-sample R-squared, delivering over 400 basis points annual certainty-equivalent gains.

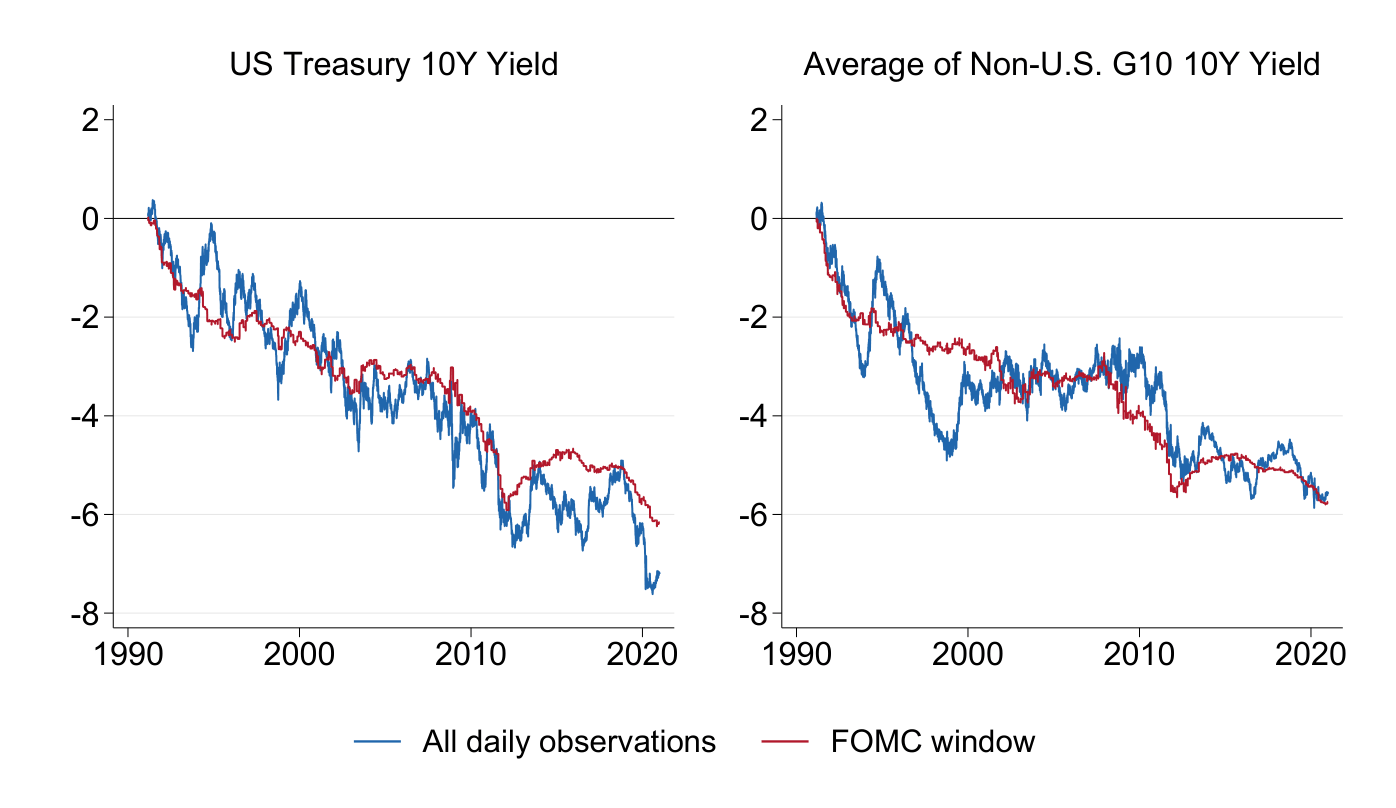
  3. US 10Y Treasury yields and G10 average yields declining from 1990-2020, with FOMC windows highlighted.
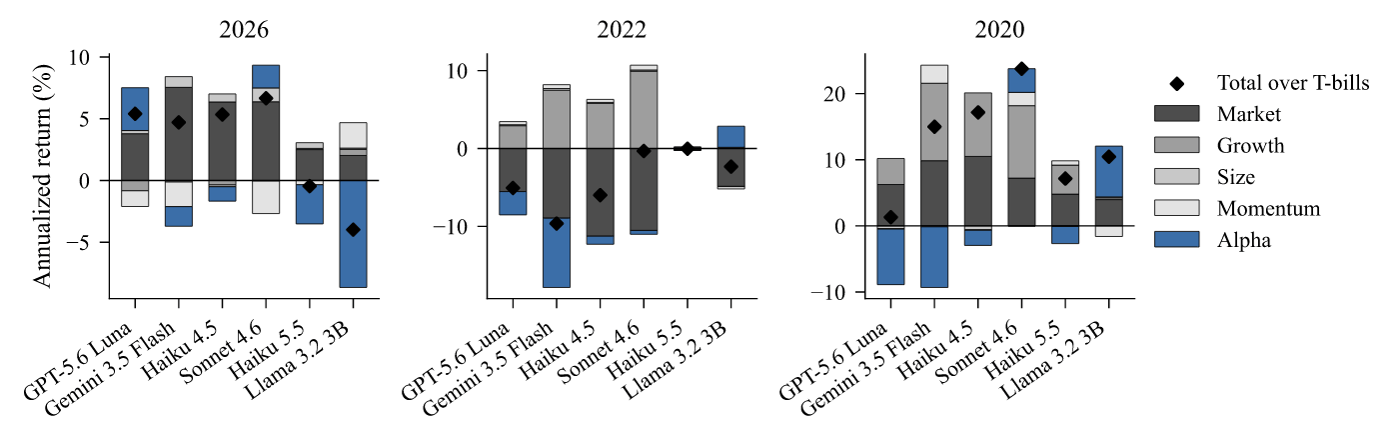
  4. Stacked bar charts showing returns decomposed into market, growth, size, momentum factors, and alpha across models and years.
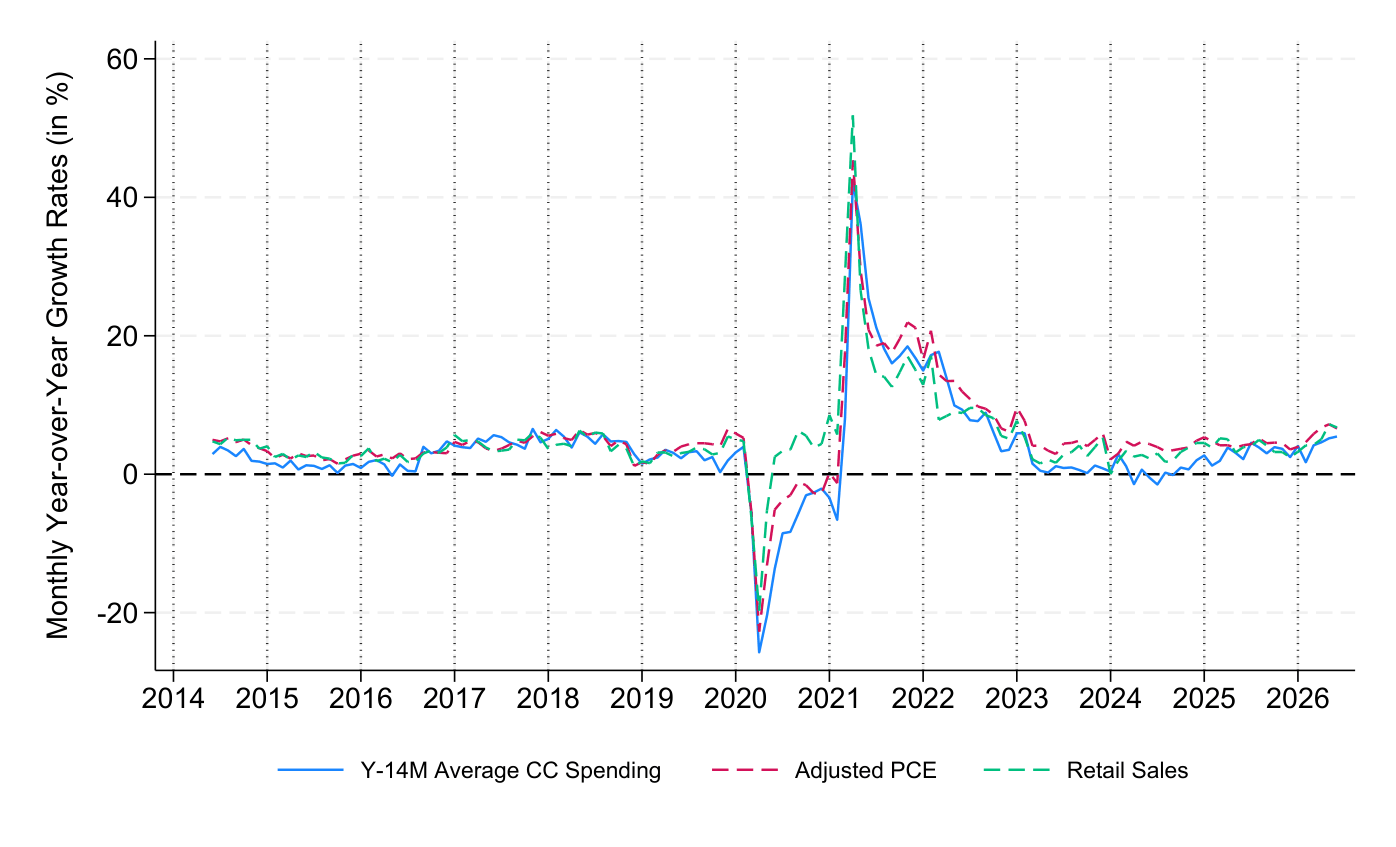
  5. Monthly national consumption growth comparing credit card spending, adjusted PCE, and retail sales from 2014-2026.

What's rising

Topics drawing unusually many papers this week.

  1. Time-series foundation models

    2.9×

    0.9% of this week's 676 new papers, 2.9x its share over the previous 8 weeks (0.3%).

  2. Backtesting

    1.6×

    3.4% of this week's 676 new papers, 1.6x its share over the previous 8 weeks (2.2%).

  3. Option pricing

    1.8×

    1.8% of this week's 676 new papers, 1.8x its share over the previous 8 weeks (1.0%).

GitHub radar

What the quant community starred on GitHub this week, from a panel of 10,589 developers who follow financial machine learning (259 of the 858 we checked starred something). Counts only: we never publish who starred what.

Quant repos rising

  1. Claude Code skills for equity investors: market analysis and trading.

    ★ 7,371+3,051 this weekPython

  2. LLM-powered multi-market stock analysis with real-time news.

    ★ 73.5k+1,710 this weekPython

  3. Forward-testing harness for crypto perpetuals trading on Bybit.

    ★ 422+224 this weekPythonNew repo

  4. Free open source order flow screener for crypto trading.

    ★ 225+36 this weekTypeScriptNew repo

  5. GPU-accelerated factor analysis library and backtester.

    ★ 956+122 this weekPython

  6. Winning algorithmic trading strategy for electronic trading.

    ★ 46+21 this weekPython

  7. Open-source TradingView alternative with Pine script support.

    ★ 94+77 this weekRustNew repo

  8. 11 Claude skills for day trading chart analysis and exits.

    ★ 8,870+1,225 this weekPythonNew repo

What quants are playing with

  1. Multi-agent framework for automated AI research paper writing.

    ★ 5,336+5,143 this weekPython

  2. Rewrite apps in Rust piece by piece with behavior verification.

    ★ 6,241+6,243 this weekRustNew repo

  3. Keep coding agents updated with latest web best practices.

    ★ 23.8k+12.0k this week

  4. Claude Code skill bundle for bug hunting and red-teaming.

    ★ 13.7k+7,890 this weekPython

  5. Small fast container runtime for macOS, Windows and Linux.

    ★ 11.6k+9,090 this weekRustNew repo

  6. Chatbot written in pure Python by swarm of agents.

    ★ 1,015+1,013 this weekPythonNew repo

  1. Now publishedEfficient simulation of a new class of Volterra-type SDEs

    Now published in Fractional Calculus and Applied Analysis · featured 7 Jun 2023, 2 days after release; 2 citations

  2. Now publishedThe effect of capital share on income inequality: identifying the time patterns

    Now published in The Journal of Economic Inequality · featured 8 Jan 2025, 4 days after release; 2 citations

  3. Now publishedThe amplifier effect of artificial agents in social contagion

    Now published in npj Complexity · featured 5 Mar 2025, 5 days after release; 2 citations

All papers

Filter by venue, topic or fanfare.

Venue
Topic
Fanfare
90 papers

arXiv

Quantitative finance and ML-for-finance preprints

30 papers · 29 figures

ML & AI Methods7

01

AI Multiverse Analysis of Finance Research

An AI-powered replication of 324 papers reusing natural experiments finds only 25% of defensible specifications preserve published sign and significance, quantifying dependence on analysis choices.

Fanfare 4ML & AI MethodsRuijiang Gao and Steven Chong XiaoPDF
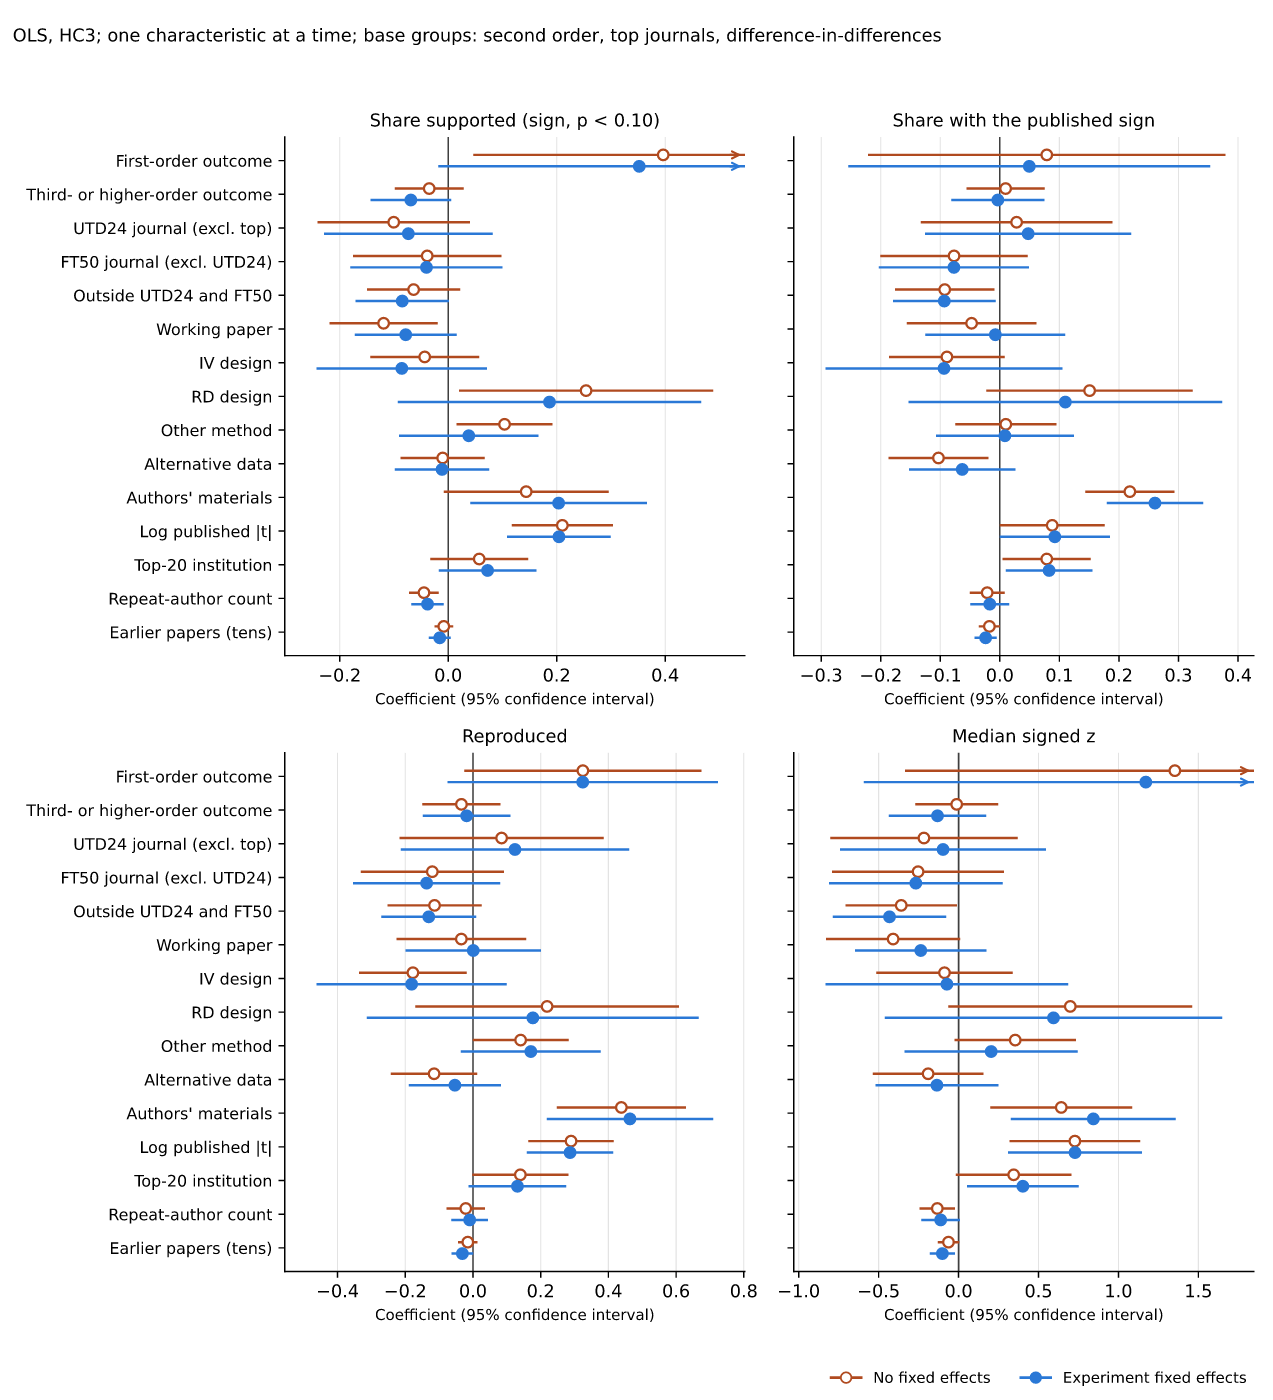
Paper characteristics and the outcomes, one characteristic at a time
Figure 3: Paper characteristics and the outcomes, one characteristic at a time
02

LLM Trading Agents Earn Beta Not Alpha

A look-ahead-free benchmark of six language-model traders across three markets finds no significant alpha; market exposure explains 78% of returns and agent decisions match random sector picks.

Fanfare 4ML & AI MethodsJackson WangPDF

Stacked bar charts showing returns decomposed into market, growth, size, momentum factors, and alpha across models and years.
Fig. 4: Each model’s annualized return over T-bills in its blind runs (diamonds), split into the parts that its exposures to the market, growth, size and momentum factor…
04

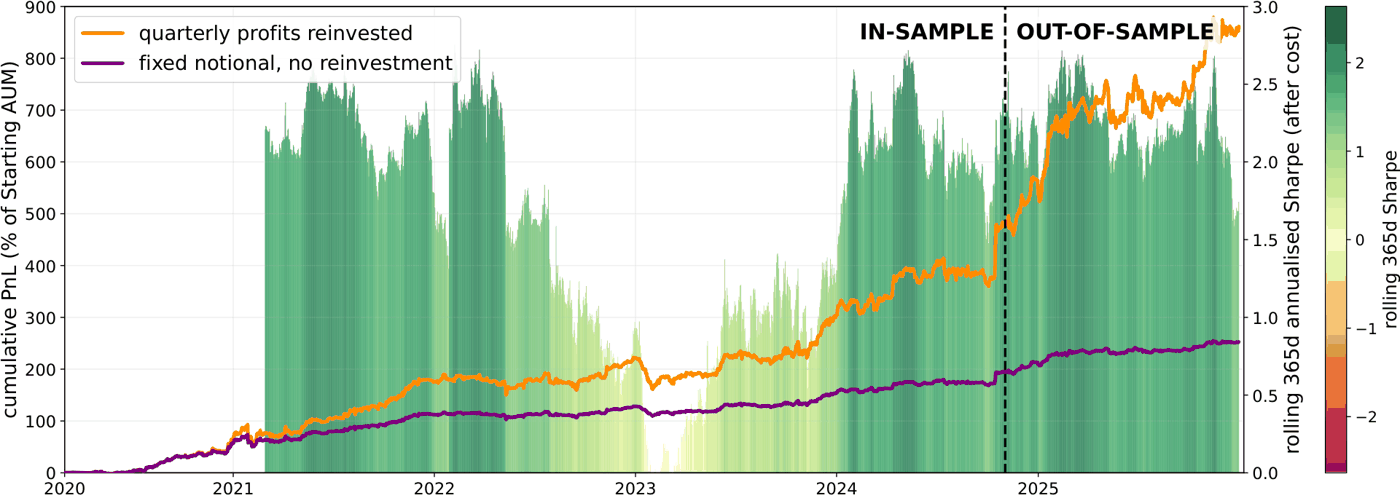
End-to-End Portfolio Trading with AllocFlow

An end-to-end flow-matching framework generates joint portfolio allocations directly from market data using a Transformer, trained via imitation learning and reinforcement learning to optimize allocation decisions.

Fanfare 3ML & AI MethodsAnnan Wang et al.PDF

Portfolio cumulative PnL over time showing in-sample and out-of-sample trading performance.
Figure 1: After-cost trading performance from 01 Jan 2020 to 31 Dec 2025. The dashed line marks the out-of-sample start. Purple shows cumulative PnL on fixed notional, o…
07

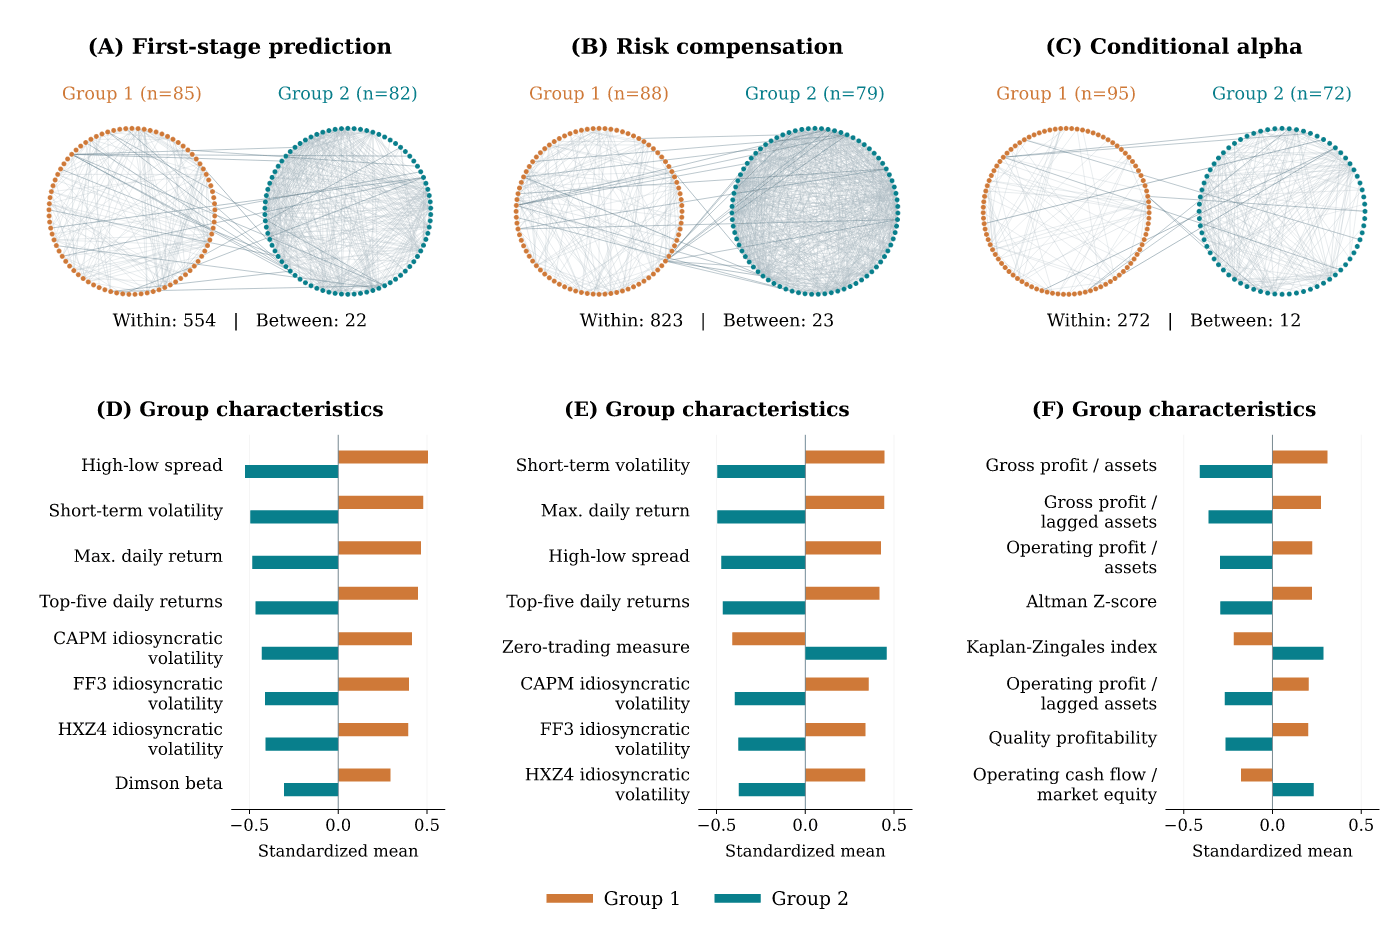
Conditional Asset Pricing Transformer

A two-stage transformer framework decomposes excess returns into conditional mispricing and factor risk compensation while establishing approximation bounds and characterizing prediction error propagation.

Fanfare 3ML & AI MethodsHao Fu et al.PDF

Cross-firm attention networks and their economic profiles
Figure 2: Cross-firm attention networks and their economic profiles
17

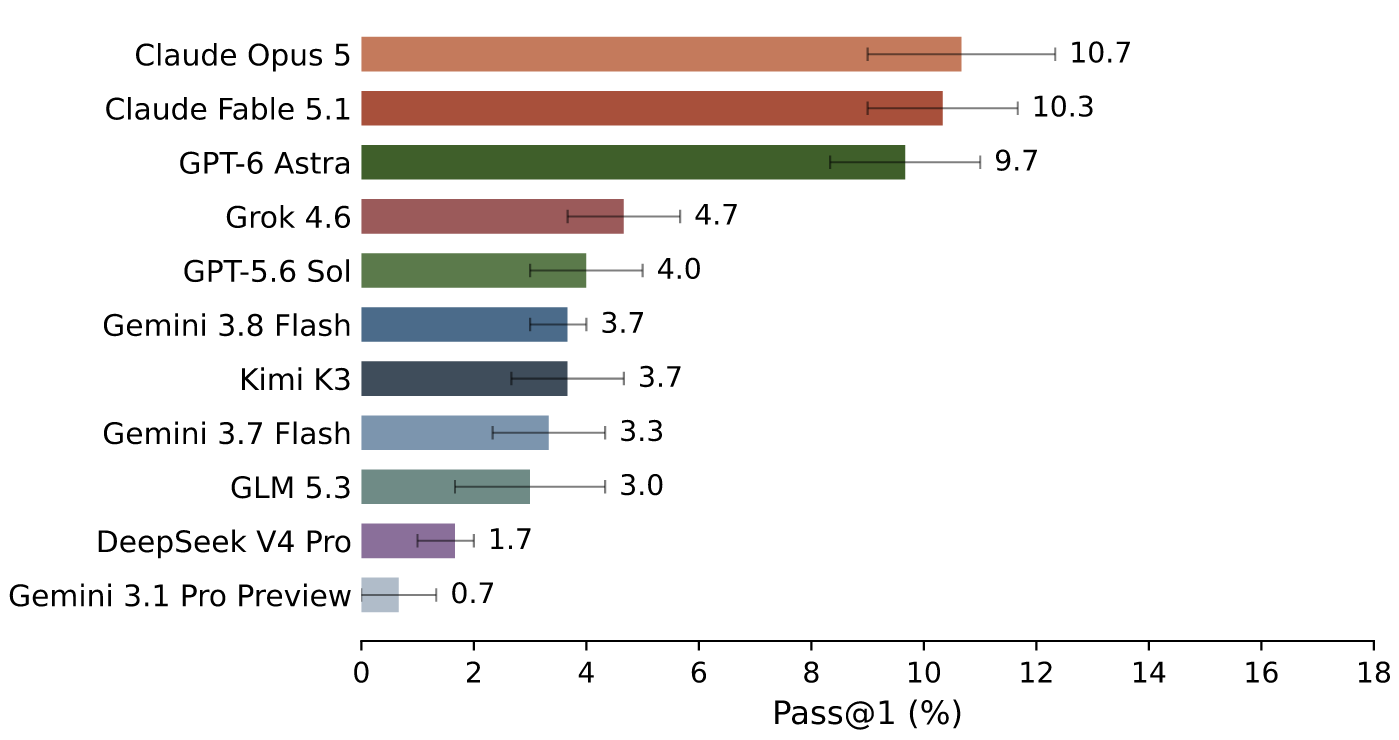
ATLAS-Finance: AI Agent Banking Tasks

A benchmark of 100 investment-banking tasks across simulated firms shows frontier AI agents complete substantial work but pass fewer than 11% of expert-rubric tasks end-to-end.

Fanfare 2ML & AI MethodsElaine Lau et al.PDF

Pass rates on ATLAS-Finance tasks across AI agents, with error bars showing confidence intervals
Figure 4 : Pass rates on ATLAS-Finance. Error bars show 95% confidence intervals computed via bootstrap.
24

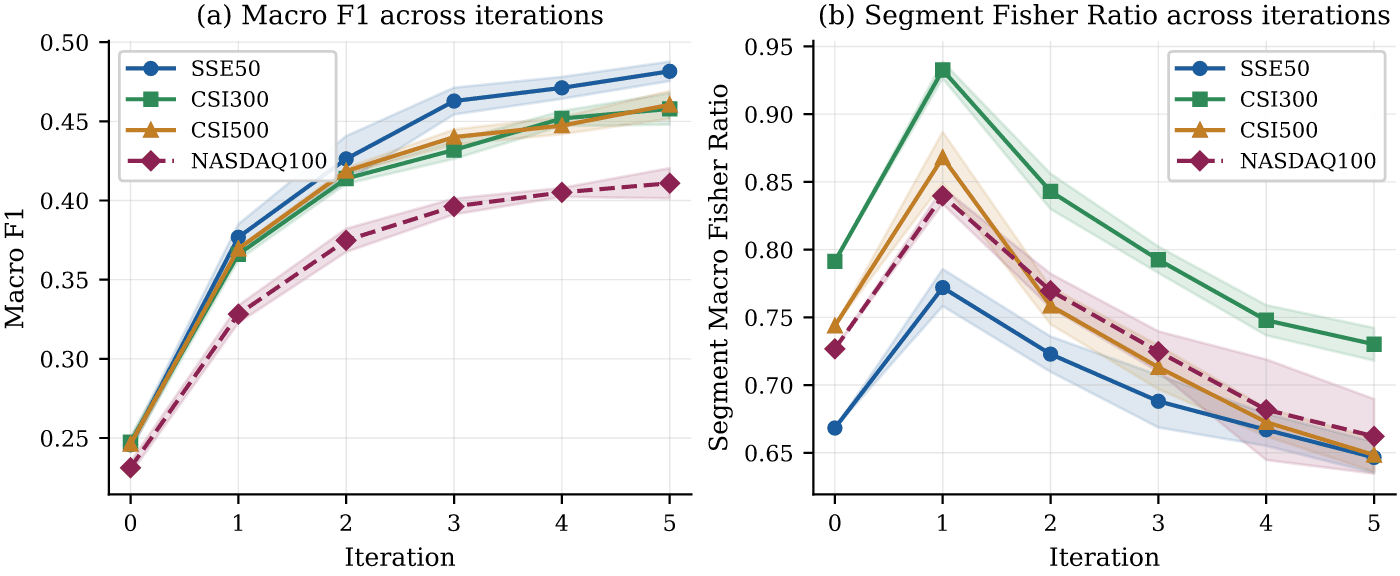
DDSL: Iterative Self-Labeling Market States

An iterative self-labeling framework couples a Viterbi labeler with a Transformer classifier through feedback, lifting market-state classification F1 by 78-96% over single-pass methods.

Fanfare 2ML & AI MethodsXianbin Gu et al.PDF

Macro F1 and segment Fisher ratio improve across iterations on four market datasets.
Figure 2: Full iteration trajectories underlying Table 2 . Transformer joint-state macro F1 increases across all four datasets (a), whereas \text{FR}_{\text{seg}} peaks…
25

Execution-Aware ML for Trading Decisions

An end-to-end framework integrates market data, execution-aware labels, and ensemble models to output structured trading recommendations with entry, stop-loss, and take-profit levels.

Fanfare 2ML & AI MethodsAditya Bhardwaj and Xingchen ZhangPDF

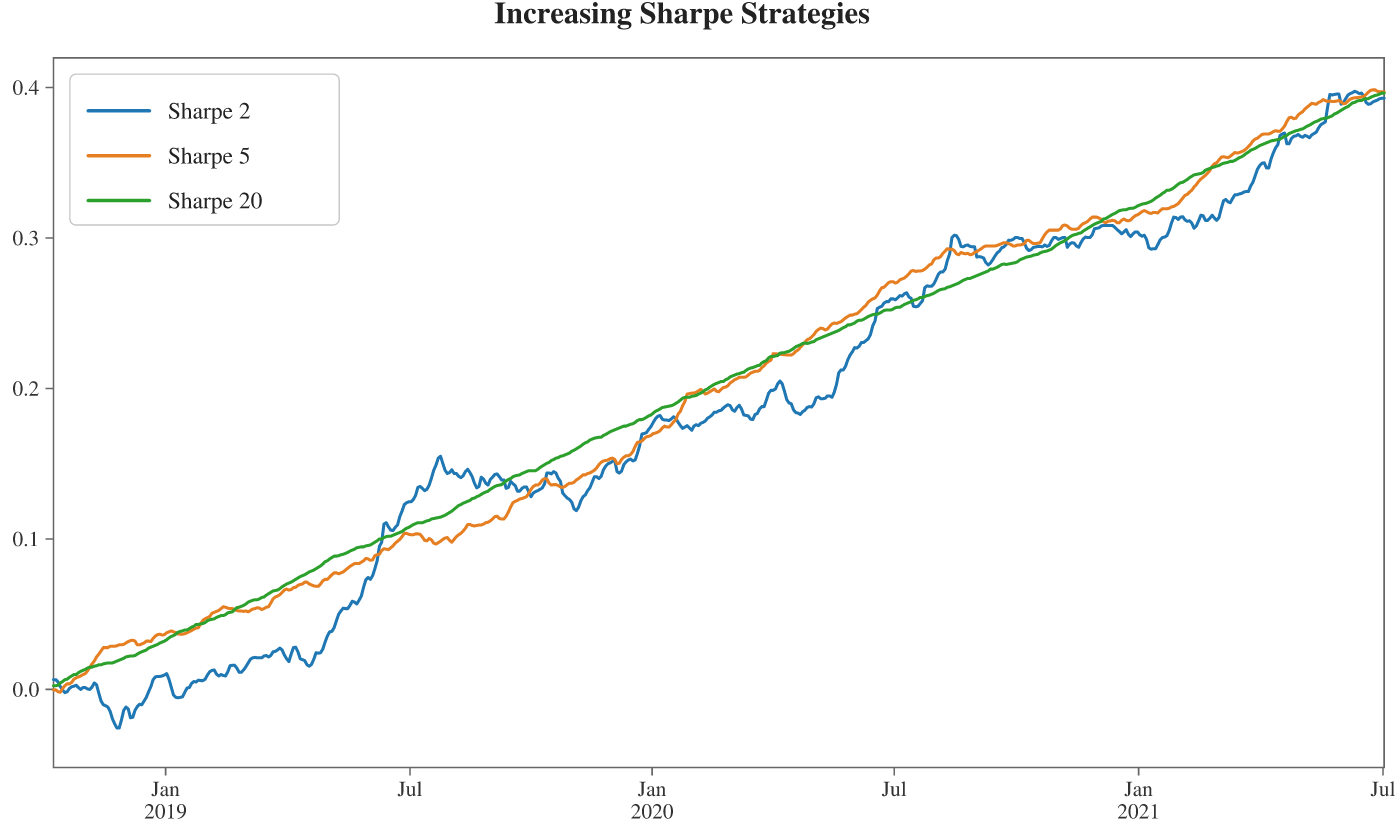
Illustration of how higher-Sharpe strategies produce smoother and more stable returns, whereas lower-Sharpe strategies
Figure 3: Illustration of how higher-Sharpe strategies produce smoother and more stable returns, whereas lower-Sharpe strategies exhibit greater fluctuations despite sim…

LLMs & Text4

03

Explaining Realized Returns With AI Reasoning

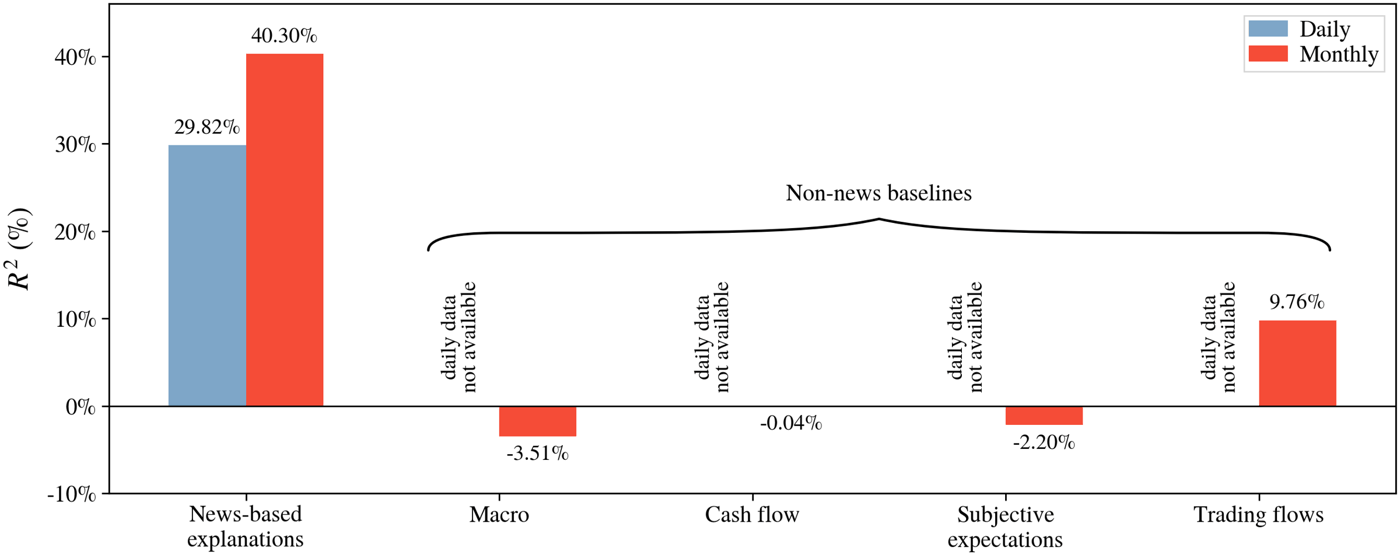
Using AI to extract reasons from market news summaries, the research shows that narrative explanations capture 30-40% of daily and monthly equity return variation, far exceeding conventional variables.

Fanfare 4LLMs & TextBryan Kelly et al.PDF

Bar chart comparing explanatory power of news-based reasons versus traditional variables for returns
Figure 1 : Out-of-sample explanatory power of market returns by news and non-news explanations
09

Earnings Calls Without Hindsight

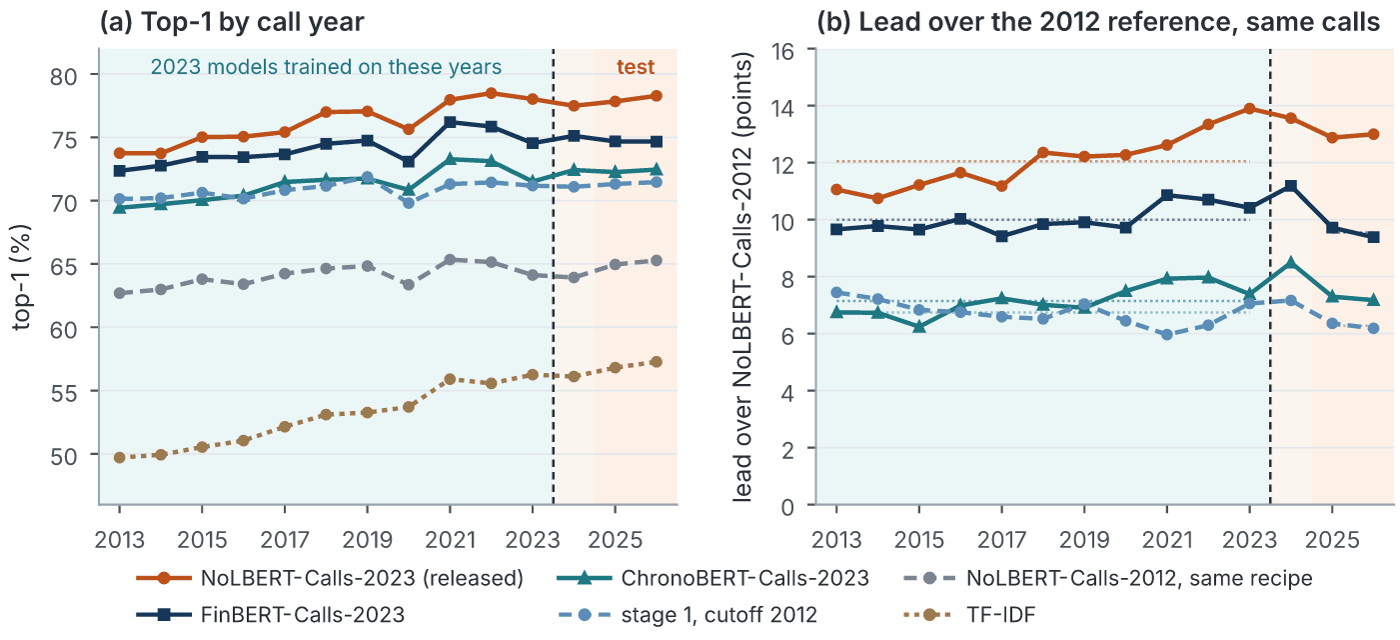
The study adapts a 1976-1995 pretrained encoder to identify management answers to analyst questions in earnings calls through 2026, reaching 78% accuracy versus 8% by chance.

Fanfare 3LLMs & TextKevin Foley et al.PDF

The time test
Figure 6 : The time test. (a) Top-1 by call year, on 500 US calls a year for 2013–2024 and on the full main test for 2025 and 2026. Teal shading marks the years the 2023…
18

Measuring Temporal Contamination in LLMs

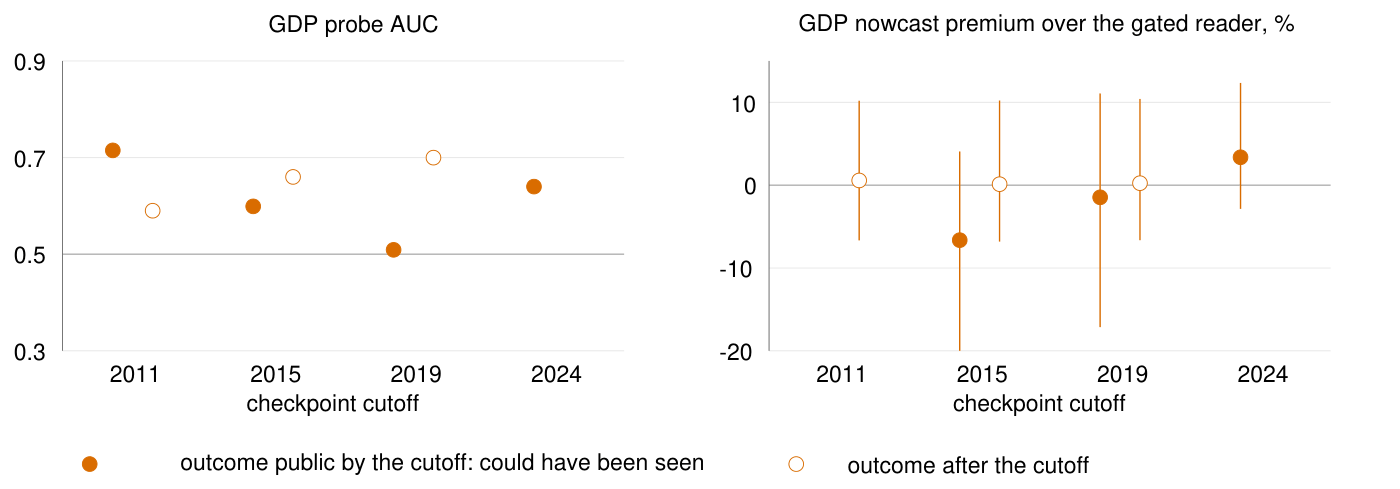
Compares modern language models to chronologically consistent baselines on FOMC statements, finding lookahead premiums in real-time GDP nowcasts are undetectable at macroeconomic sample sizes.

Fanfare 2LLMs & TextArunkumar V et al.PDF

GDP probe AUC and nowcast premium across ChronoGPT checkpoint cutoffs with confidence intervals.
Figure 4: The ChronoGPT ladder: each checkpoint on outcomes it could have seen (filled) and could not (open), GDP probe AUC (left) and GDP nowcast premium over the gated…
28

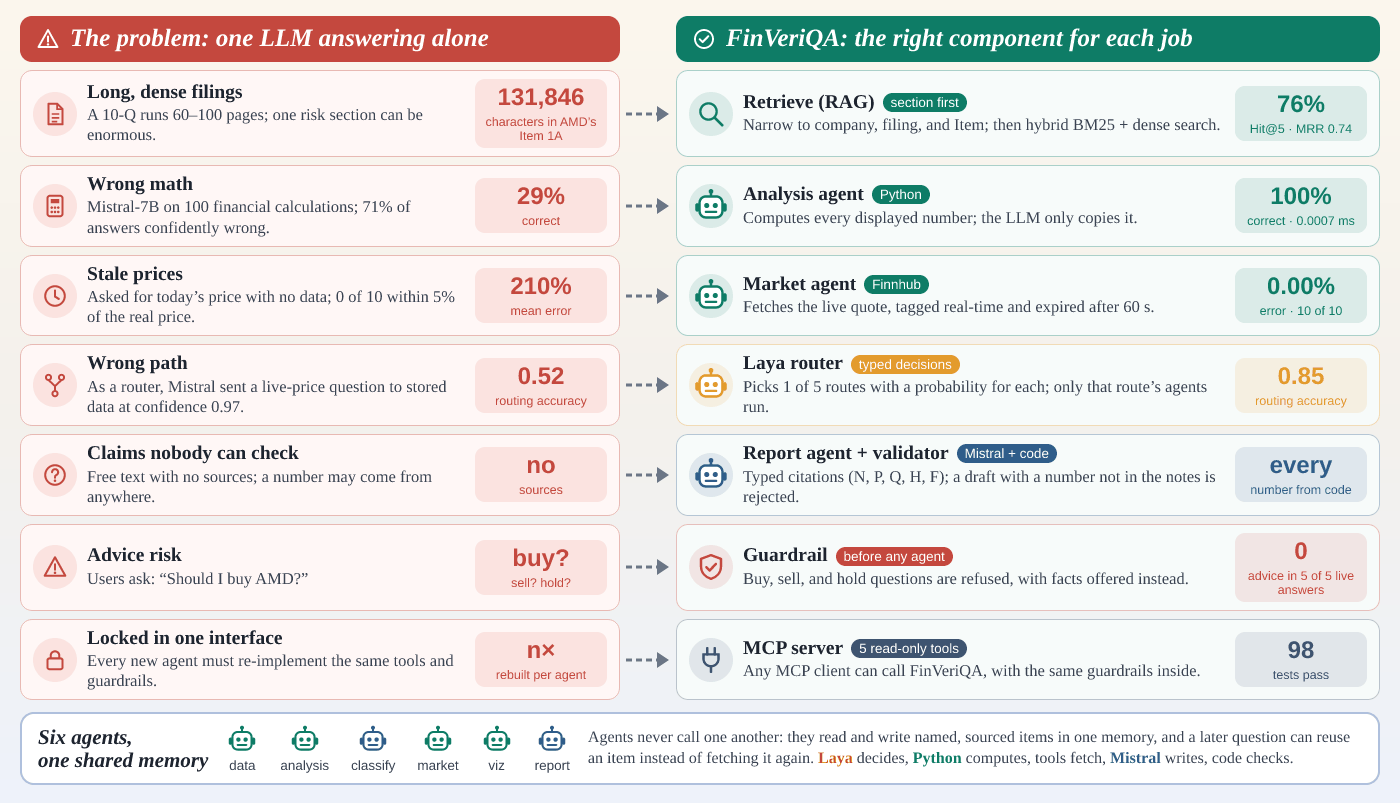
FinVeriQA: Financial Question-Answering Agents

A multi-agent research system routes questions, retrieves SEC data, computes ratios in Python, and validates cited evidence; a compact routing model outperforms language models on task assignment.

Fanfare 2LLMs & TextMeenakshi Rajpurohit et al.PDF

The problem FinVeriQA addresses (left) and how it addresses it (right)
Figure 1: The problem FinVeriQA addresses (left) and how it addresses it (right). The measured numbers come from our experiments and case study ( Section 5 ); each fix o…

Trading, Microstructure & Execution2

05

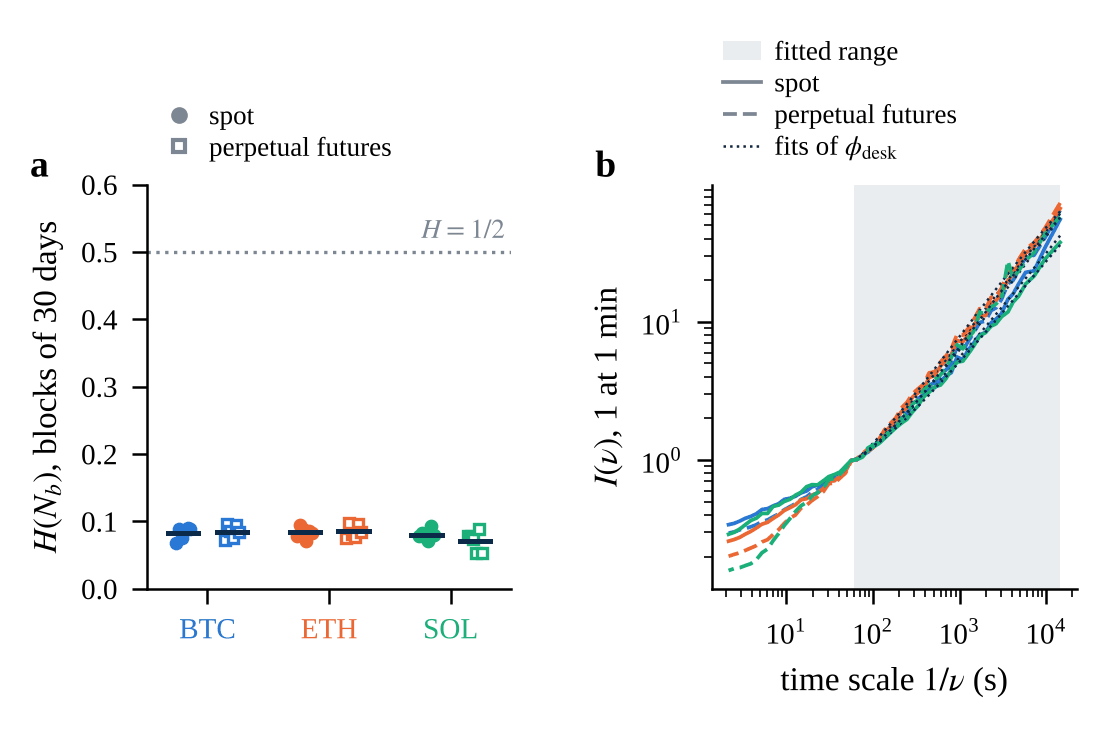
Algorithmic Market Making Drives Rough Volatility

The research shows that stochastic gradient descent by asynchronous market makers with power-law memory in order flow generates rough volatility, confirmed on simulated agents and Binance data.

Fanfare 3Trading, Microstructure & ExecutionSai Niranjan RamachandranPDF

Rough volatility exponent H=1/2 measured across Bitcoin, Ethereum, and Solana markets with spot and futures data.
Figure 2. Activity and kernel of the six markets, 10 April to 6 October 2026. (a) H(N_{b}) in each block of 30 days, with the mean over the blocks. (b) Periodogram I(\nu…
11

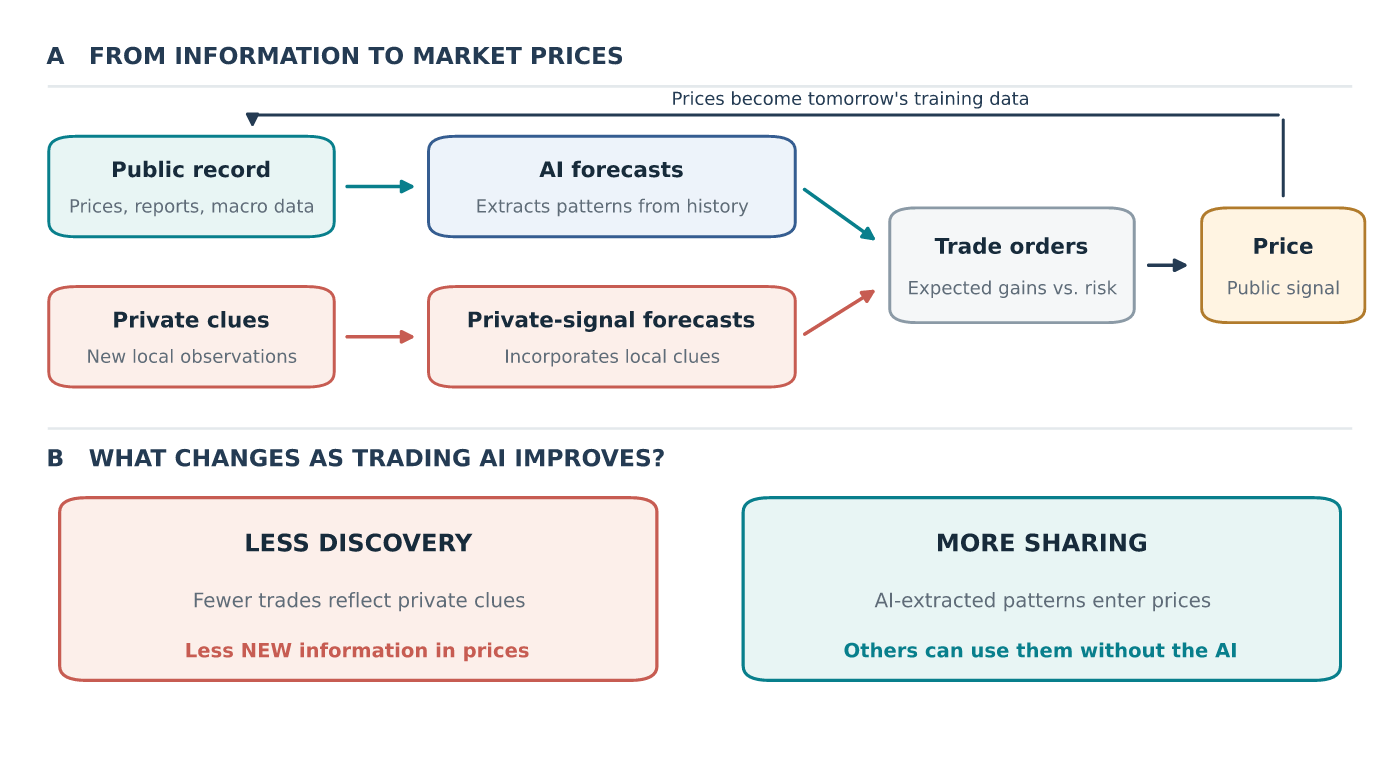
Opposing Informational Effects of AI Trading

Better AI can improve individual forecasts while weakening price informativeness by substituting public-data analysis for private observation, reducing private information aggregated into prices.

Fanfare 3Trading, Microstructure & ExecutionHajime ShimaoPDF
From private clues and public records to prices
Figure 1: From private clues and public records to prices. (A) Investors combine their own private information with forecasts drawn from published data; trading on both…

Portfolio & Allocation2

06

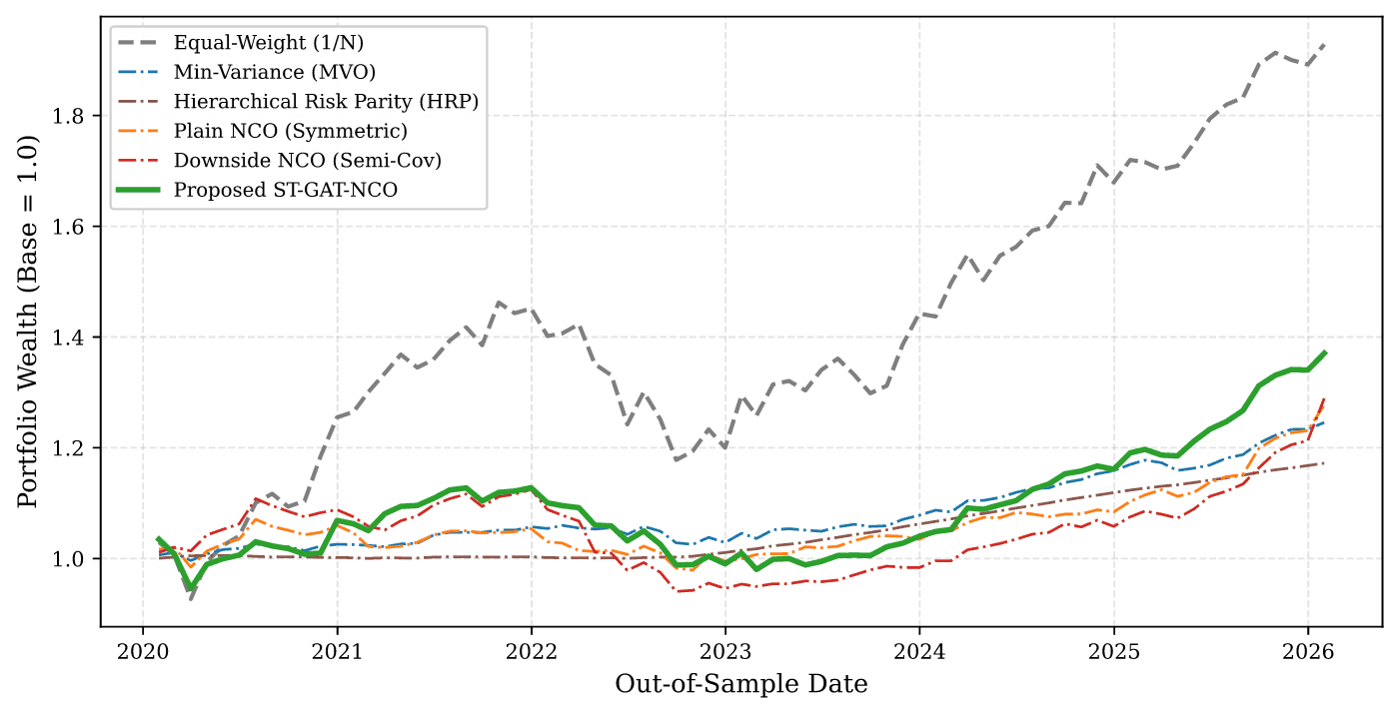
Spatio-Temporal Graph Attention for Multi-Asset Allocation

A graph attention network learns time-varying downside risk contagion to guide nested clustered optimization, achieving 5.32% annualized returns and 0.30 excess Sharpe ratio across 13 asset classes.

Fanfare 3Portfolio & AllocationSupriadiPDF

Cumulative portfolio wealth comparison across five allocation methods, 2020-2026, ST-GAT-NCO outperforms consistently.
Fig. 2: Cumulative portfolio wealth evolution (logarithmic scale) across the 73-month out-of-sample period (January 2020 to January 2026). ST-GAT-NCO consistently outper…
21

Pooled ARMA for Stock Volatility Forecasting

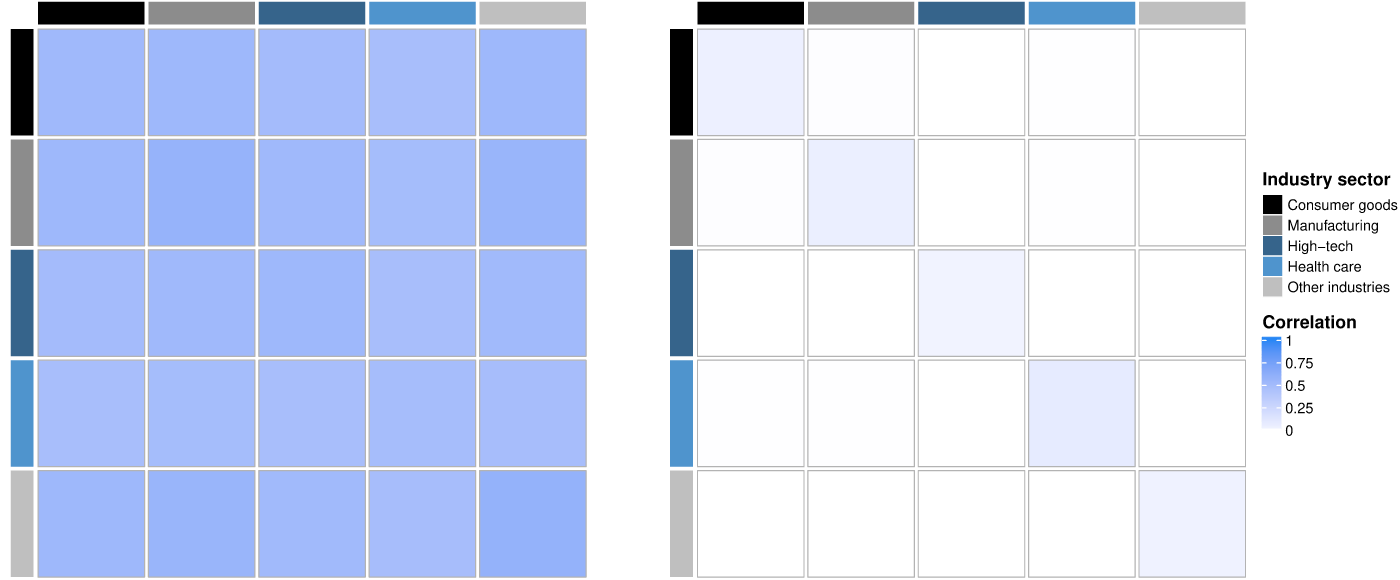
Pooled ARMA models that share dynamic parameters within stock groups outperform latent factor models for minimum-variance portfolio selection on S&P 500 constituents.

Fanfare 2Portfolio & AllocationDominik Ammon and Julian HeinzPDF

Heatmap of correlations for monthly realized volatilities ( left ) and idiosyncratic volatilities after accounting for
Figure 1: Heatmap of correlations for monthly realized volatilities ( left ) and idiosyncratic volatilities after accounting for cross-sectional variation using three pr…

Macro-Finance & Rates2

08

Geoengineering Put, Termination Risk and Asset Prices

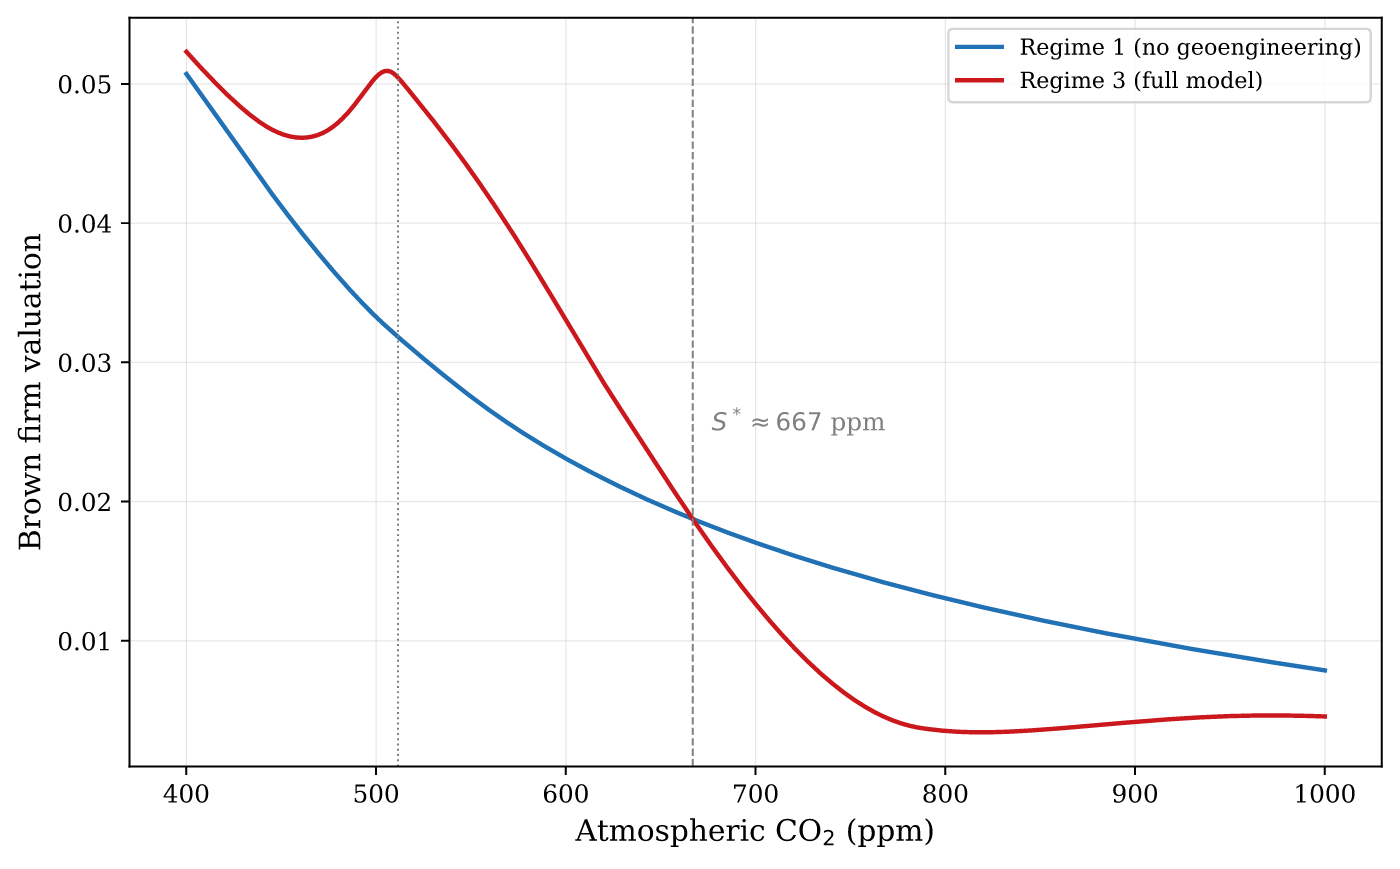
Solar geoengineering acts as a put option on climate damages, raising brown-firm valuations today but creating termination risk that could render these firms toxic assets if deployment stops.

Fanfare 3Macro-Finance & RatesSamuel Hartzmark and Kelly ShuePDF

Brown firm valuation versus CO2 levels, showing toxic put option effect at high concentrations.
Figure 3: Brown Firm Valuations and the Toxic Put. The vertical axis shows firm value per unit of productivity A , with one unit corresponding to the pre-termination ann…
29

Hull-White Scenario Engine for Macro Stress

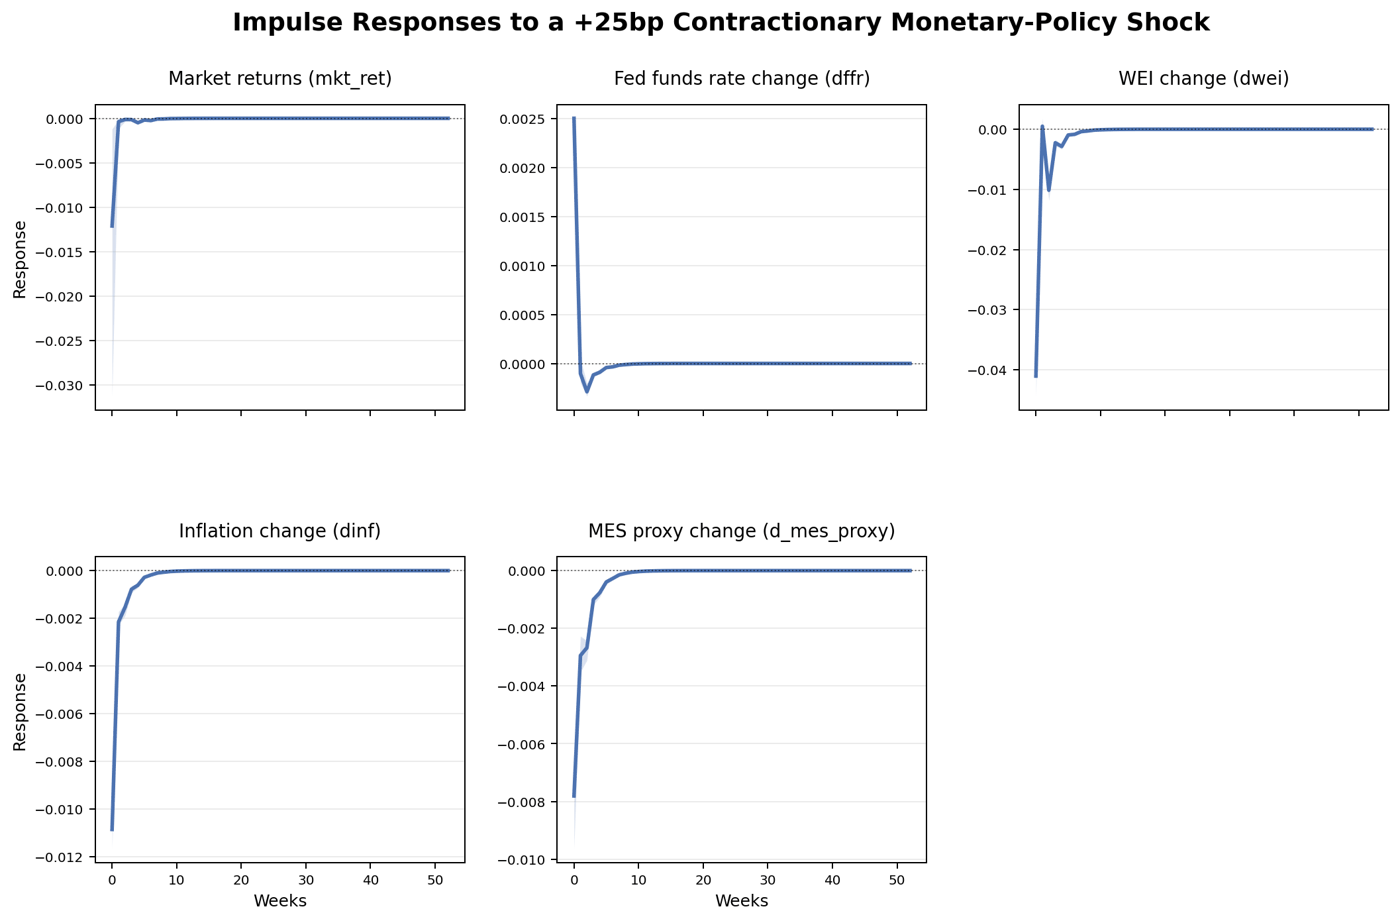
The study builds a three-factor Hull-White model that maps yield-curve paths into forecasts of equity returns, inflation and other macro variables, showing strong out-of-sample performance from 2017 to 2024.

Fanfare 2Macro-Finance & RatesAhmad Qadi et al.PDF

Impulse responses to a +25 bp contractionary policy shock, first twelve weeks
Figure 1: Impulse responses to a +25 bp contractionary policy shock, first twelve weeks. Lines: medians across accepted rotations; shading and the bar at impact: 10–90%…

Asset Pricing & Factors2

10

Auto-Alpha: Autonomous Factor Research

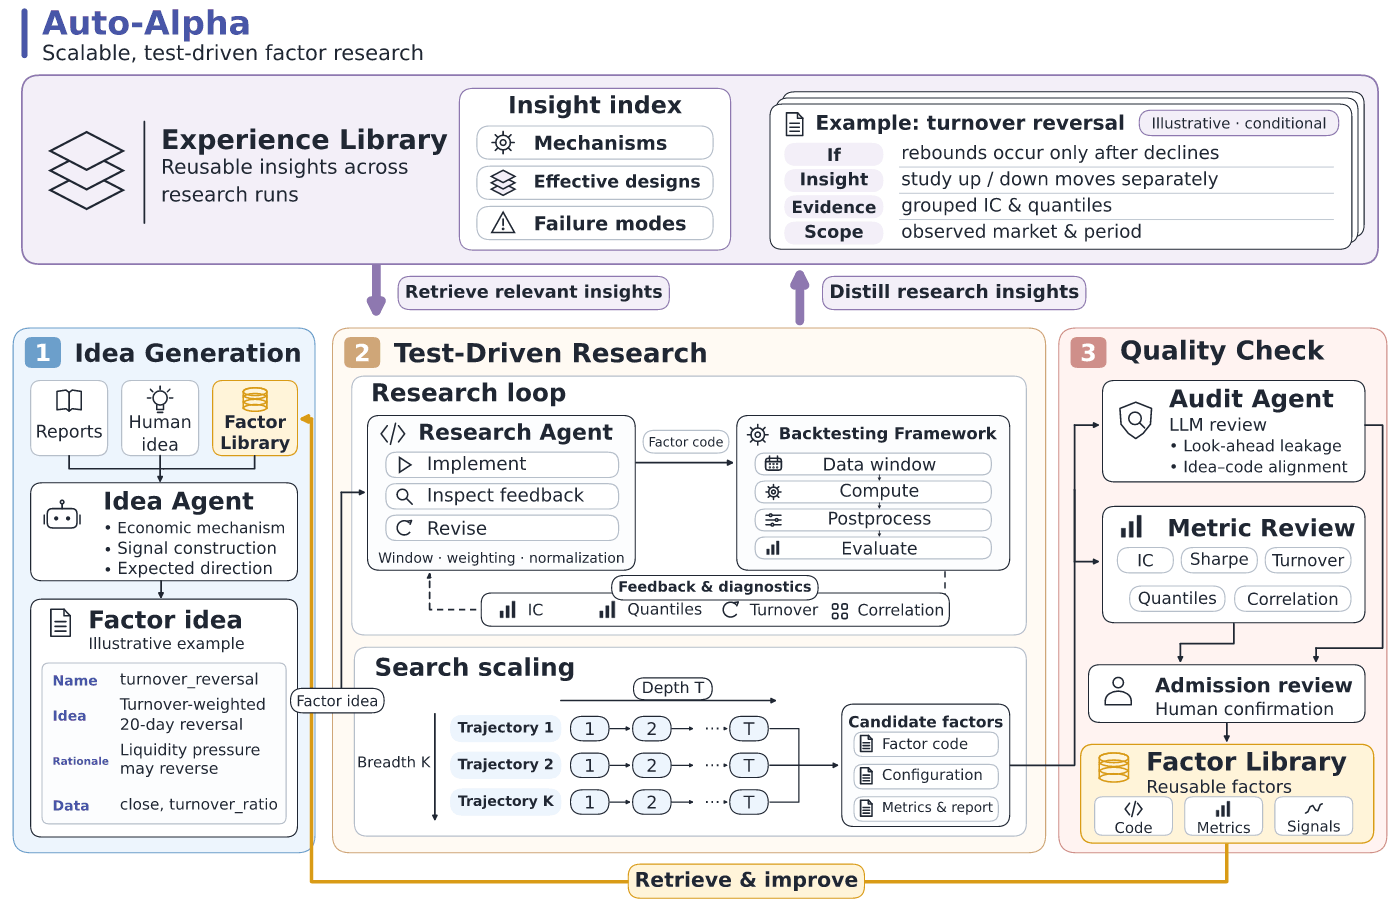
A framework connects economic reports to self-directed research via backtest feedback, retaining 62 factors from initial development and 32 from reports.

Fanfare 3Asset Pricing & FactorsHui Cai et al.PDF

Auto-Alpha system architecture showing factor research workflow with libraries and feedback loops
Figure 1: Auto-Alpha’s factor-research architecture. Report-grounded proposals bootstrap the workflow; subsequent ideas can draw on the Factor Library and Experience Lib…
26

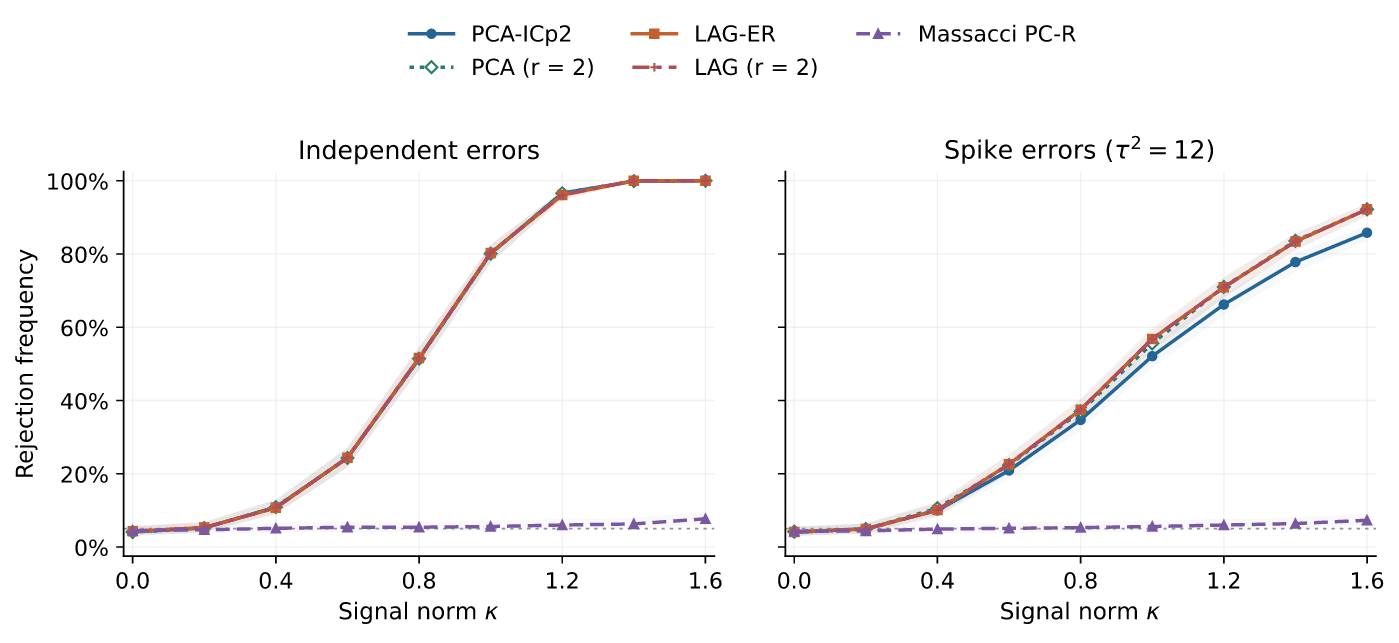
Adaptive Tests of Pricing Restrictions

Develops high-dimensional tests for asset pricing models with observed and latent factors, detecting when pricing errors can be explained by estimated latent-factor loadings.

Fanfare 2Asset Pricing & FactorsAnlin Liu et al.PDF

Power comparison for a fixed dense direction
Figure 2: Power comparison for a fixed dense direction.

Risk, Credit & Banking3

12

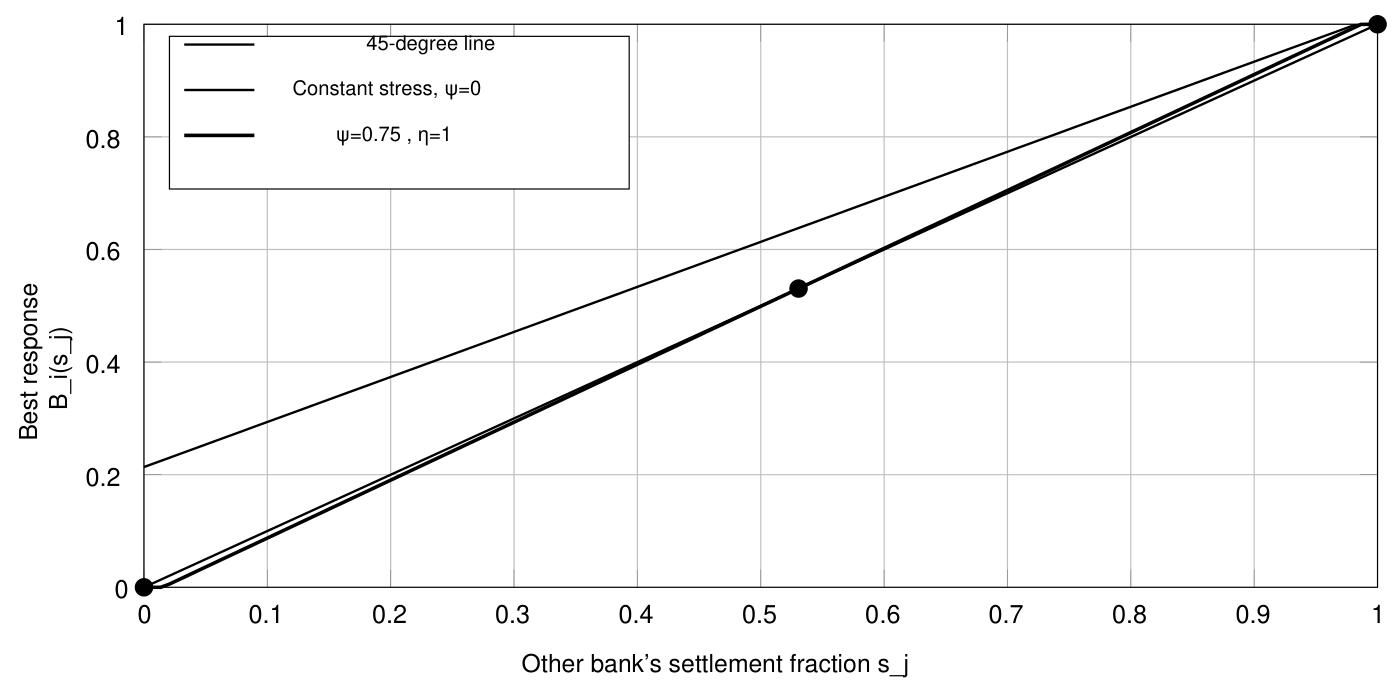
Strategic Repayment and Financial Network Fragility

The study shows that banks may rationally withhold feasible payments to insure against future funding needs, creating multiple equilibria and hidden fragility even under stable fundamentals.

Fanfare 3Risk, Credit & BankingHicham El KaissiPDF

Best-response curves showing multiple equilibria from zero to full payment as function of counterparty settlement.
Figure 2: Best-response comparison in a mechanically regular network. The upper-pass-through calibration admits full payment, a partial interior coordination threshold a…
15

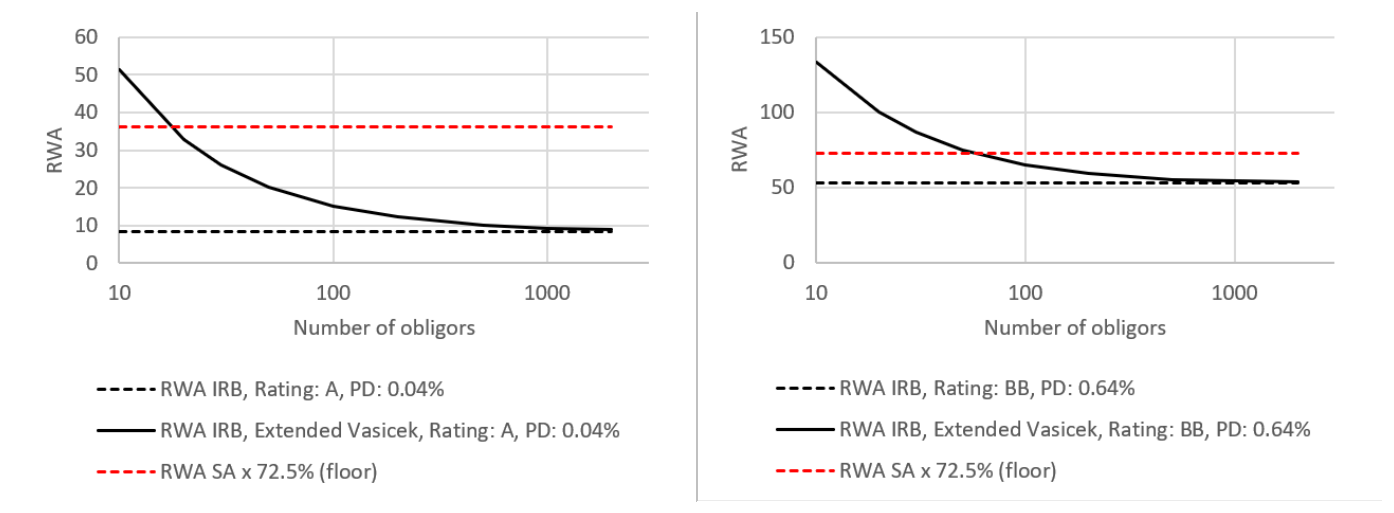
Extended Vasicek for Finite Credit Portfolios

The study extends the Vasicek distribution to finite portfolios using moments and the Cornish-Fisher expansion, enabling adjusted risk-weighted asset calculations for small portfolios under 100 obligors.

Fanfare 2Risk, Credit & BankingMarco van der BurgtPDF

RWA comparison curves showing finite portfolio effects across obligor counts
30

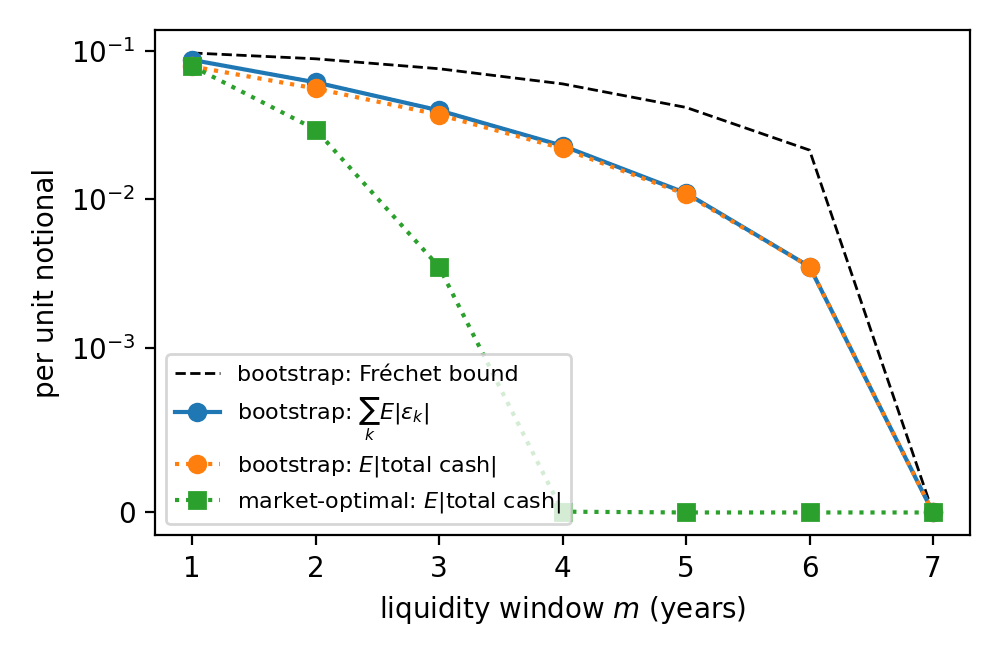
Adapted Wasserstein Distance for Credit Risk

The research applies optimal transport to measure disagreement between credit models on information unfolding, deriving closed-form distances for rating reviews and showing implications for hedging credit bonds.

Fanfare 2Risk, Credit & BankingLuca Di Persio and Francesco MattesiniPDF

Intra-year migration model, initial rating BB: hedging errors as functions of the liquidity window (symmetric
Figure 3. Intra-year migration model, initial rating BB: hedging errors as functions of the liquidity window (symmetric logarithmic scale).

Derivatives & Volatility5

14

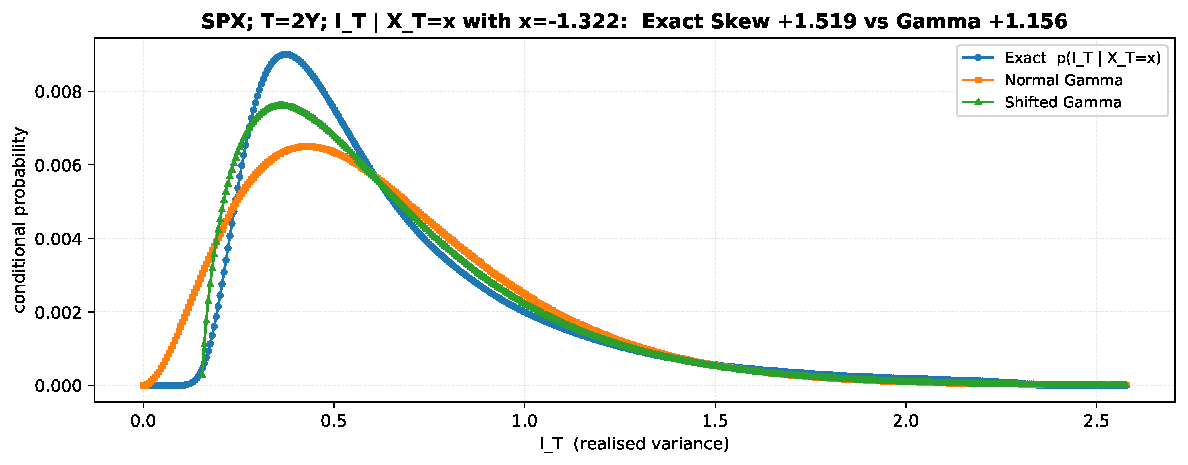
Conditional-Gamma Pricing for Leveraged ETF Options

The conditional-Gamma method prices leveraged ETF options by conditioning on terminal returns, achieving a 158- to 236-fold speed-up over a benchmark PDE.

Fanfare 2Derivatives & VolatilityGuolin Chen et al.PDF

Shifted Gamma can capture the lower bound
Figure 1 : Shifted Gamma can capture the lower bound
16

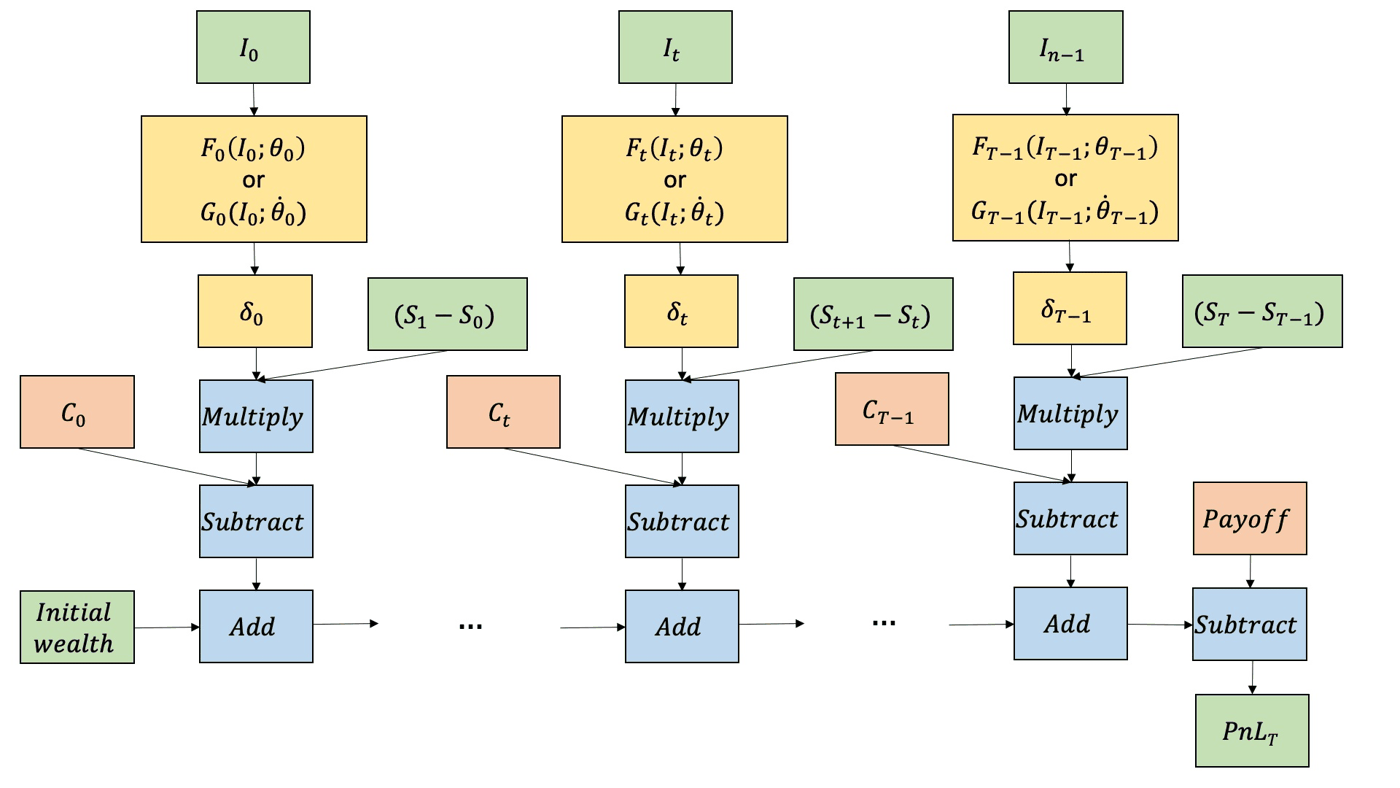
X Hedging with LightGBM Ensembles

Replaces neural networks in Deep Hedging with LightGBM tree ensembles, delivering comparable hedging performance with better explainability, efficiency, and robustness in data-limited settings.

Fanfare 2Derivatives & VolatilityBjørn André Aaslund et al.PDF

Visual overview of X Hedging and Deep Hedging frameworks
Figure 1: Visual overview of X Hedging and Deep Hedging frameworks. Green boxes show inputs/outputs, blue boxes denote mathematical operations, orange boxes represent su…
19

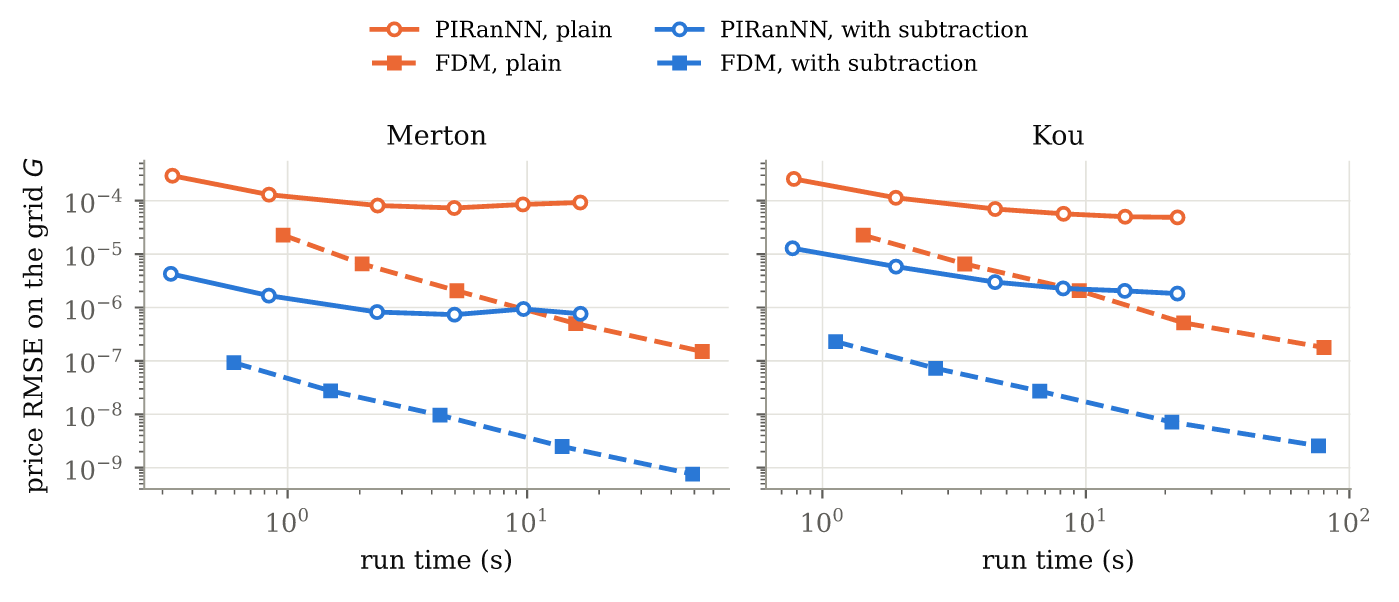
PIRanNN: Random-Feature Pricing Under Jump Models

A single-layer random-feature network with fixed weights prices European options under jump-diffusion and stochastic-volatility models via regularized least squares, matching finite-difference accuracy in seconds.

Fanfare 2Derivatives & VolatilitySaurabh Bansal et al.PDF

Price RMSE versus runtime comparing PIRanNN and finite-difference methods across two jump models.
Figure 2: Price RMSE on G against run time, for one feature draw of PIRanNN with 300 to 3000 features (circles; mean over four single draws) and for the Crank–Nicolson s…
20

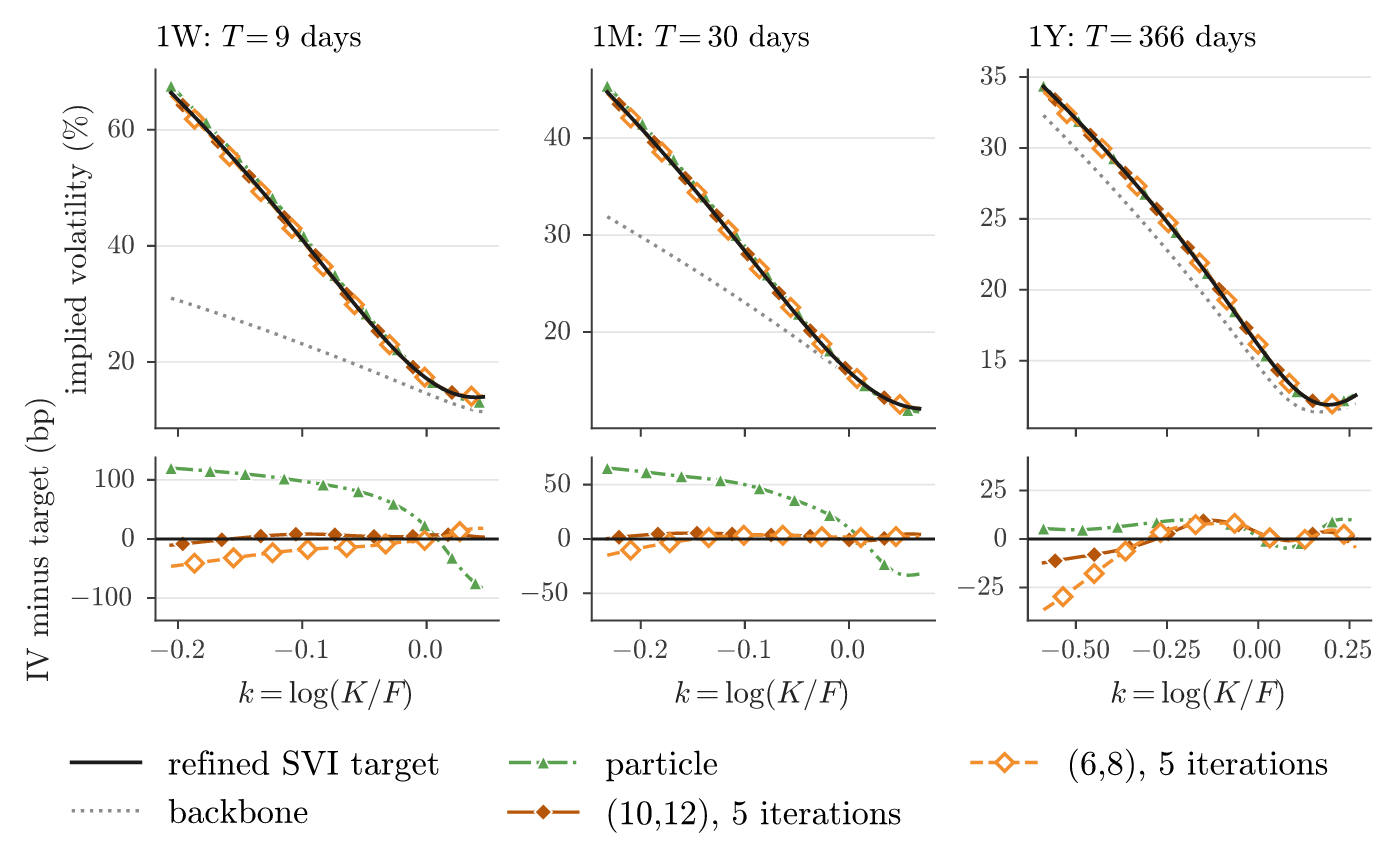
Local Stochastic Volatility Fixed-Point Iteration

A calibration method determines leverage factors for local stochastic volatility models by fixed-point iteration, reproducing S&P 500 implied volatility surfaces within basis points of observed quotes.

Fanfare 2Derivatives & VolatilityChristian Bayer et al.PDF

Implied volatility smiles of SPX options on 18 December 2024 at 9 , 30 and 366 days
Figure 1. Implied volatility smiles of SPX options on 18 December 2024 at 9 , 30 and 366 days. Top: the refined SVI target, the Bergomi model as calibrated on 20 Novembe…
23

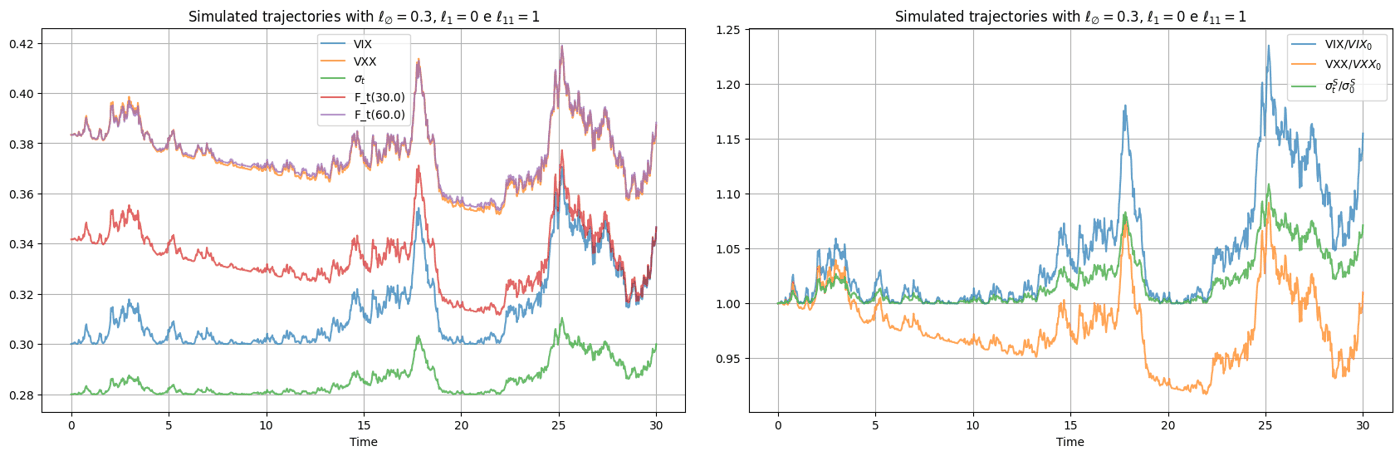
Joint SPX, VIX and VXX Framework

A unified model specifies VIX dynamics and recovers SPX variance from the requirement that its expected thirty-day average equals squared VIX, enabling joint calibration across equity and volatility markets.

Fanfare 2Derivatives & VolatilityMartino Grasselli et al.PDF

Simulated trajectories with a Brownian primary process
Figure 1: Simulated trajectories with a Brownian primary process

Econometrics & Forecasting2

22

High-Dimensional Factor Models with Score-Driven Dynamics

The study combines principal components extraction with score-driven model estimation to capture nonlinearities and heavy tails, delivering valid asymptotic prediction intervals for high-dimensional time series.

Fanfare 2Econometrics & ForecastingMatteo Barigozzi and Enzo D'InnocenzoPDF
27

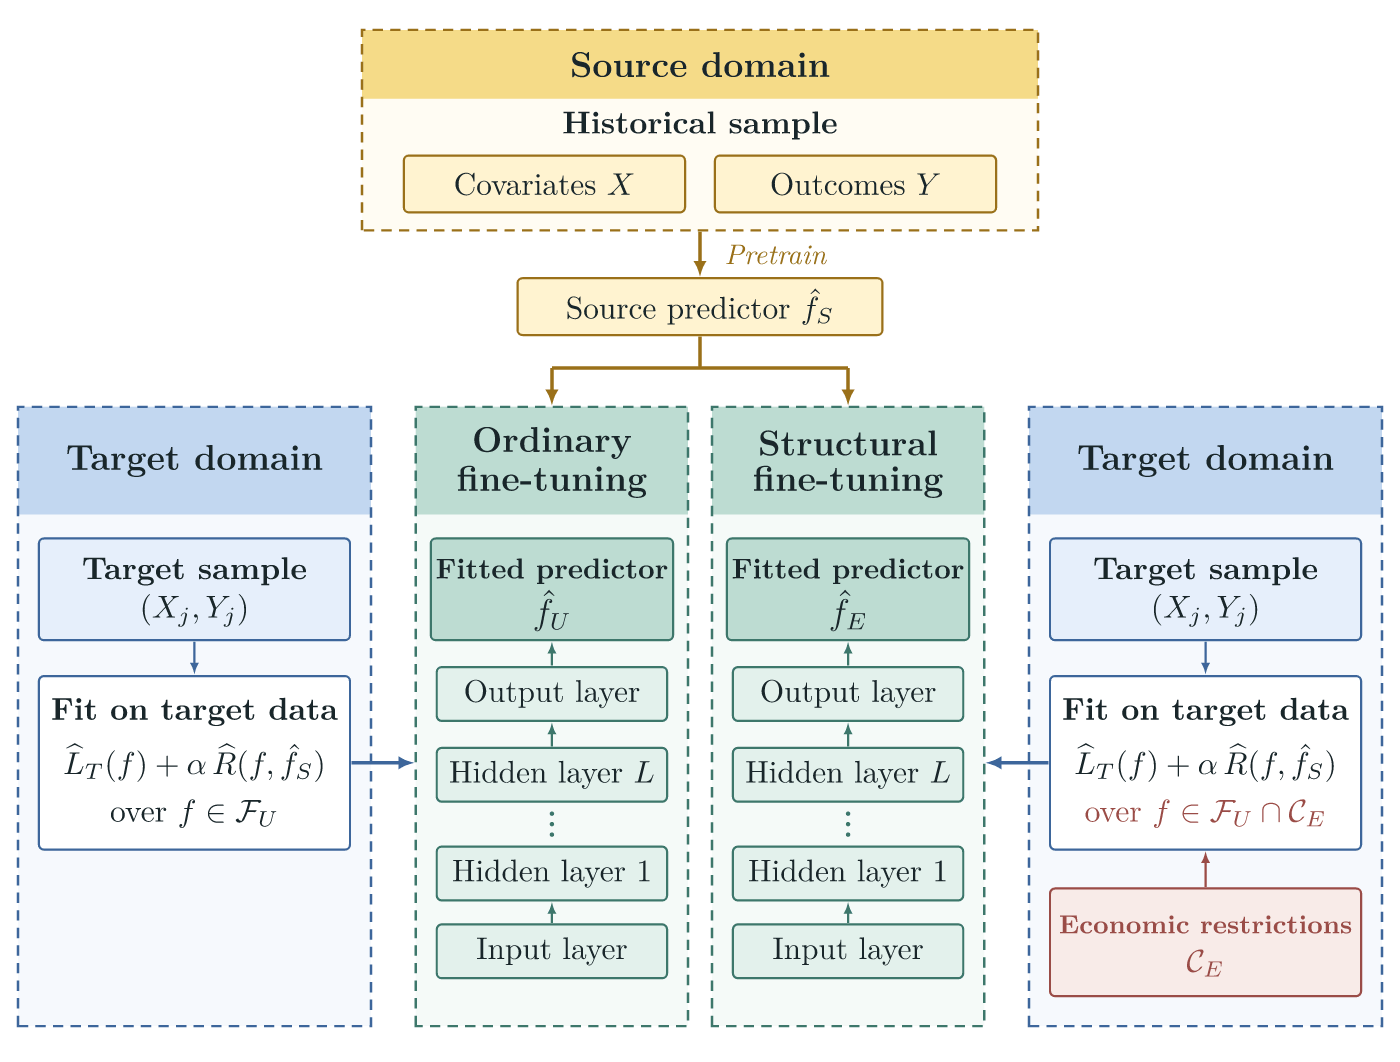
Structural Fine-Tuning Under Economic Constraints

A framework adapts pretrained predictors to new economic environments by imposing constraints based on economic knowledge, lowering prediction error by 28-39% in a credit-limit scenario.

Fanfare 2Econometrics & ForecastingYi Niu et al.PDF
Ordinary fine-tuning (left) and structural fine-tuning (right)
Figure 1 : Ordinary fine-tuning (left) and structural fine-tuning (right).

Also notable1

13

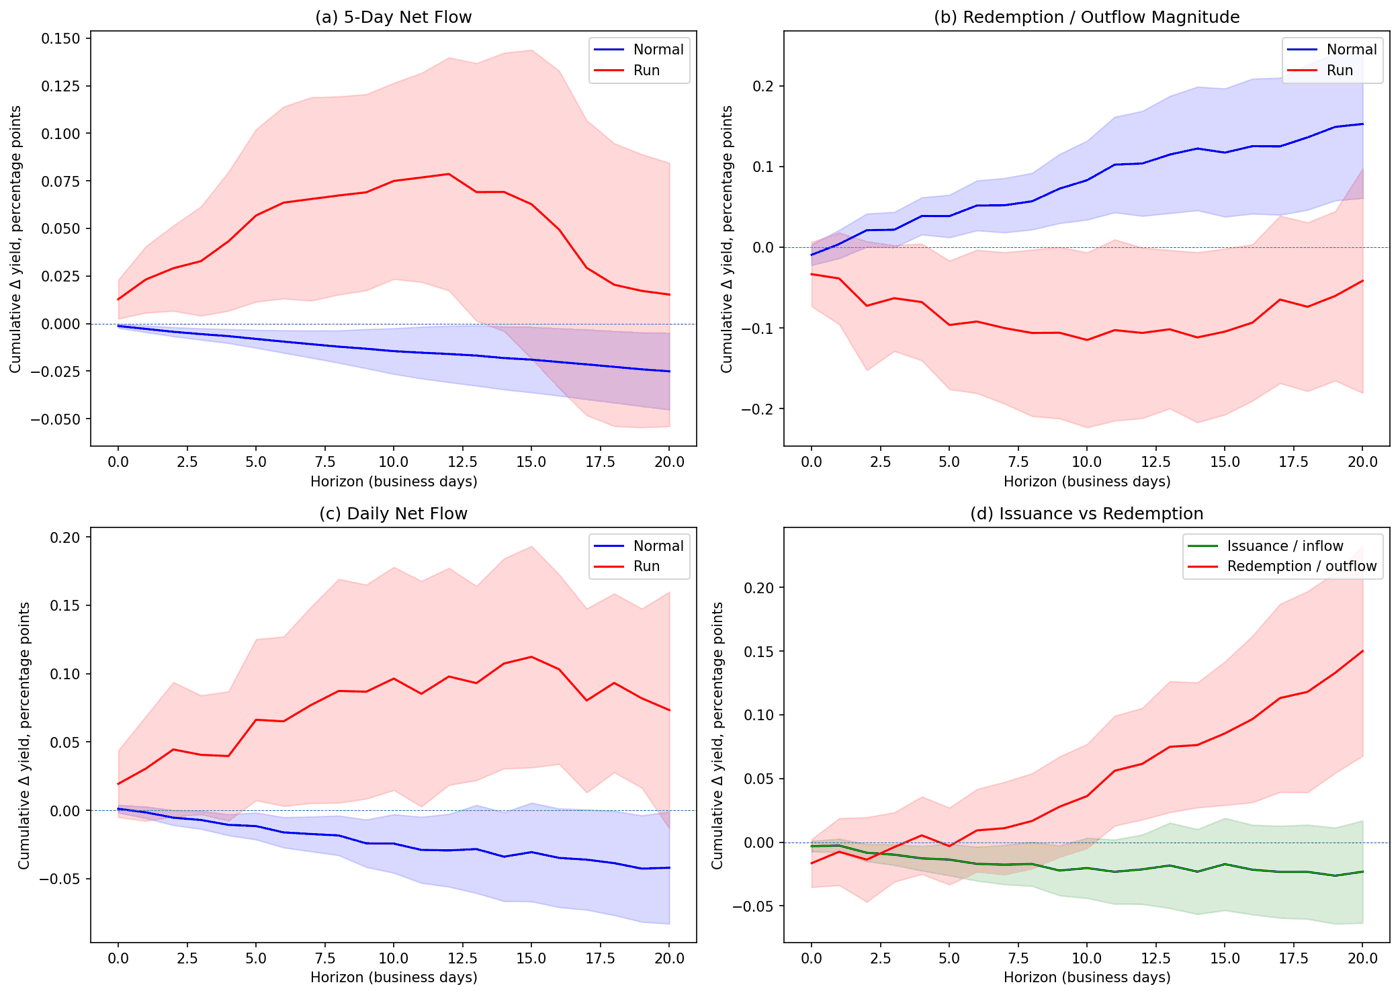
Stablecoin Runs Signal Treasury Stress

During panic-driven runs, five-day stablecoin redemptions of one billion dollars predict three-month bill yield declines of 8.5 basis points, signaling flight to quality.

Fanfare 3Crypto & DeFiAhmad Qadi et al.PDF
Local projection impulse responses, five-day redemption magnitude
Figure 4: Local projection impulse responses, five-day redemption magnitude. Shading: 90% Newey–West confidence bands.

SSRN

New working papers in finance, economics and ML

30 papers

Asset Pricing & Factors8

01

Treasury-to-Equity Ratio Predicts Stock Returns

The ratio of Treasury debt to equity market value predicts one-year stock returns with 15.8% in-sample and 16.7% out-of-sample R-squared, delivering over 400 basis points annual certainty-equivalent gains.

Fanfare 4Asset Pricing & FactorsYunlong Chen and Difang Huang

02

Common Risk Cannot Explain Stock Return Differences

An upper bound shows that common risk factors explain at most 4.7% of return differences across U.S. stocks, challenging the identification of comovement with priced risk.

Fanfare 4Asset Pricing & FactorsPaul G. Geertsema

12

Global Beliefs Drive Equity Price Comovement

A global belief factor extracted from analyst forecast revisions explains why equity prices co-move across countries more strongly than cross-border flows do.

Fanfare 3Asset Pricing & FactorsDo Lee

13

Timing the Size Factor with Neural Networks

Neural networks predict stock-level returns and aggregate them into a size-premium forecast that times the Fama-French size factor, lifting Sharpe to 0.61 in the U.S.

Fanfare 3Asset Pricing & FactorsVitor Azevedo et al.

14

Securities Lending Fees and Hong Kong Returns

Analysis of Hong Kong equities from 2013-2025 shows stocks with higher lending fees earn 1.46% per month lower returns, though economic value shrinks after borrowing costs.

Fanfare 3Asset Pricing & FactorsXukai Cai

15

Bitcoin's Required Return with Concentration Risk

A model pricing Bitcoin alongside equities and gold shows its required return is 18% annually, driven by concentration and cryptoasset mortality risks, and should decline as holders diversify.

Fanfare 3Asset Pricing & FactorsAgisilaos Papadogiannis

23

Fiscal Risk, Real Rates and Brazilian Stocks

Fiscal-risk shocks raising expected public debt lift real interest rates 11 basis points and weaken the real; firms earning revenue domestically underperform exporters by 2.5 percentage points.

Fanfare 3Asset Pricing & FactorsIrineu Evangelista De Carvalho Filho

24

Symbolic Regression for Equity Premium Prediction

Deep symbolic regression identifies parsimonious nonlinear models that forecast aggregate equity premiums with lower out-of-sample errors than linear and random-forest benchmarks.

Fanfare 3Asset Pricing & FactorsIgor Kuznetsov

Derivatives & Volatility4

03

Dealer Gamma Momentum Explains Daily Returns

Daily change in dealer gamma exposure explains same-day S&P 500 returns with an R-squared of 17.6%, matching return direction on 80.5% of days.

Fanfare 4Derivatives & VolatilityPankaj ji Mathurawale and Preeti Sharma

09

Neural Spectral Dimension for Rough Volatility

The research introduces a framework linking the roughness of stochastic volatility to neural-network complexity through spectral dimension, organizing variance reduction for American option pricing.

Fanfare 3Derivatives & VolatilityMaheep Sharma

18

Dealer Gamma and Intraday Market Fragility

A hedging-feedback model shows negative dealer gamma scaled by market depth raises daily return volatility by 7.9% under continuous hedging and 12.2% when hedging concentrates near close.

Fanfare 3Derivatives & VolatilityM. Adam Khan

30

QQQ Straddles Are Well Calibrated to Realized Moves

Nasdaq-100 option straddles accurately price expected moves from one day to three months, with implied and realized moves differing by economically small amounts.

Fanfare 2Derivatives & VolatilityMatthias Backhaus

Trading, Microstructure & Execution6

04

Quants vs. Traditional Institutional Trading

Quants exhibit positive-feedback trading while traditional institutions are contrarian, and crowded quant trading predicts return reversals while uncrowded trading predicts continuation.

Fanfare 4Trading, Microstructure & ExecutionRon Kaniel et al.

17

Excess Volatility in Prediction Markets

Polymarket and Kalshi prices move 23 to 39% more than the uncertainty they resolve, with the excess rising steeply as markets age, suggesting overreaction to weak information.

Fanfare 3Trading, Microstructure & ExecutionJeffrey Adrian et al.

19

Retail Investors as Accidental Market Makers

Retail investors absorb institutional demand when adverse selection deters professionals, incurring average losses of 55.5 basis points on net-buying days with no subsequent reversal.

Fanfare 3Trading, Microstructure & ExecutionFernando Chague and Matheus C. Brito

26

Portfolio Adjustment and Flow Price Impact

Institutions trade larger dollar amounts in bigger positions with stable percentage changes, suggesting adjustment costs tied to position size better explain flow-induced price responses than mean-variance models.

Fanfare 3Trading, Microstructure & ExecutionCarter Davis et al.

28

Order Flow Toxicity Detection via LightGBM

A machine-learning detector predicts toxic trades in cryptocurrency perpetual futures using L2 microstructure features, achieving 0.66 AUC-ROC and removing 12.9% of toxic trades.

Fanfare 2Trading, Microstructure & ExecutionArkadii Skvorcov

29

Cross-Hedging in Multi-Asset Market Making

A closed-form theory of portfolio market making shows that dealers cross-hedge inventory across correlated assets, and this effect is often underestimated by standard models.

Fanfare 2Trading, Microstructure & ExecutionIoanid Rosu et al.

Risk, Credit & Banking3

05

Expected Shortfall Underestimation in Market Stress

Testing regulatory expected-shortfall models across assets from 2000-2026 reveals systematic underestimation of tail losses by 10 to 44% during stress regimes, challenging capital adequacy.

Fanfare 4Risk, Credit & BankingNiraj Neupane

20

Fed Signals and European Bank Lending

European banks disentangle policy rate news from economic outlook in Federal Reserve announcements, pricing policy changes and economic signals in opposite directions within loan contracts.

Fanfare 3Risk, Credit & BankingDimitrios Gounopoulos et al.

27

Look-Ahead Bias Inflates Distress Prediction Accuracy

Using statements and database values not yet available when forecasts are made inflates distress-prediction accuracy by up to 49%, a leakage concentrating in profitability ratios.

Fanfare 3Risk, Credit & BankingJinhyung Bae

ML & AI Methods4

06

Autonomous Agents in Financial Markets

A practical guide to building and training large language model and reinforcement-learning agents for trading, covering guardrails, learning methods, and multi-agent market dynamics including herding and flash crashes.

Fanfare 4ML & AI MethodsIrene Aldridge

08

AI Model Disagreement Lacks Information Content

Six large language models' earnings forecasts from SEC filings show 5.7 times larger disagreement than analysts, but over 90% of variance is sampling noise within models, unrelated to actual filings.

Fanfare 4ML & AI MethodsJoshua Mitts et al.

10

Generative AI and Market Information Efficiency

The study argues that large language models lower the cost of processing public text, accelerating price discovery and shortening post-announcement drifts in equity markets.

Fanfare 3ML & AI MethodsRoland Rupprechter

11

AI-Based News Factors Span the Factor Zoo

Machine learning extracts interpretable economic themes from financial news that construct factors spanning and expanding the traditional factor zoo.

Fanfare 3ML & AI MethodsAntoine Didisheim et al.

Macro-Finance & Rates3

16

Kalshi Fed Futures Measure Policy Spillovers to India

Prediction-market prices of Federal Reserve rate contracts capture U.S. policy expectations and show strong spillovers to Indian bond yields and the rupee forward premium.

Fanfare 3Macro-Finance & RatesAnirudh Ponoth

21

Deposit Maturity Weakens Monetary Transmission in China

Chinese banks' shift toward time deposits weakens easing transmission because time deposits reprice at maturity, reducing demand-deposit inflows that carry monetary stimulus to firm lending and investment.

Fanfare 3Macro-Finance & RatesXi Li et al.

22

Central Bank Presence Over Purchase Size in Bonds

High-frequency tests of China's bond-purchase facility show that announcements of entry and exit, without stated amounts, move futures more than actual purchase amounts do.

Fanfare 3Macro-Finance & RatesJamin Yang and Ning Han

Also notable2

07

Leveraged Loan Factors from Public Fund Filings

SEC fund filings yield a leveraged-loan price panel tracking dealer data at 0.995 correlation and recovering identical factor returns, enabling open-access research into loan factor premiums.

Fanfare 4Portfolio & AllocationThomas Maehlmann

25

Stablecoin Regulation and De-Pegging Risk

Difference-in-differences analysis shows that EU stablecoin regulation enforcement reduced price deviations by 7.3 basis points, whereas legislation alone produced weaker effects.

Fanfare 3Crypto & DeFiZhiyuan Wang et al.

RePEc

Working papers curated by RePEc's NEP field reports

30 papers · 24 figures

Macro-Finance & Rates7

01

Fed Policy and Global Interest Rate Decline

The global fall in long-term rates since the 1990s was driven largely by yield changes during Fed announcement windows, operating through expected short-rate paths rather than term premia.

Fanfare 4Macro-Finance & RatesBoris Hofmann et al.PDF
US 10Y Treasury yields and G10 average yields declining from 1990-2020, with FOMC windows highlighted.
Figure 1: Cumulative yield changes in the U.S. and other major advanced economies (%).
07

Renminbi Invoicing in Argentine Imports

Currency swap policy experiment shows firms with dollar-scarce bank relationships and links to Chinese state banks switched to RMB for Chinese imports, with spillovers to other trading partners.

Fanfare 3Macro-Finance & RatesFelipe Benguria and Dennis NovyPDF

RMB invoicing for imports from China: Breakdown by sectors
Figure 9: RMB invoicing for imports from China: Breakdown by sectors
15

Geopolitical Risk and Euro Area Sovereign Bonds

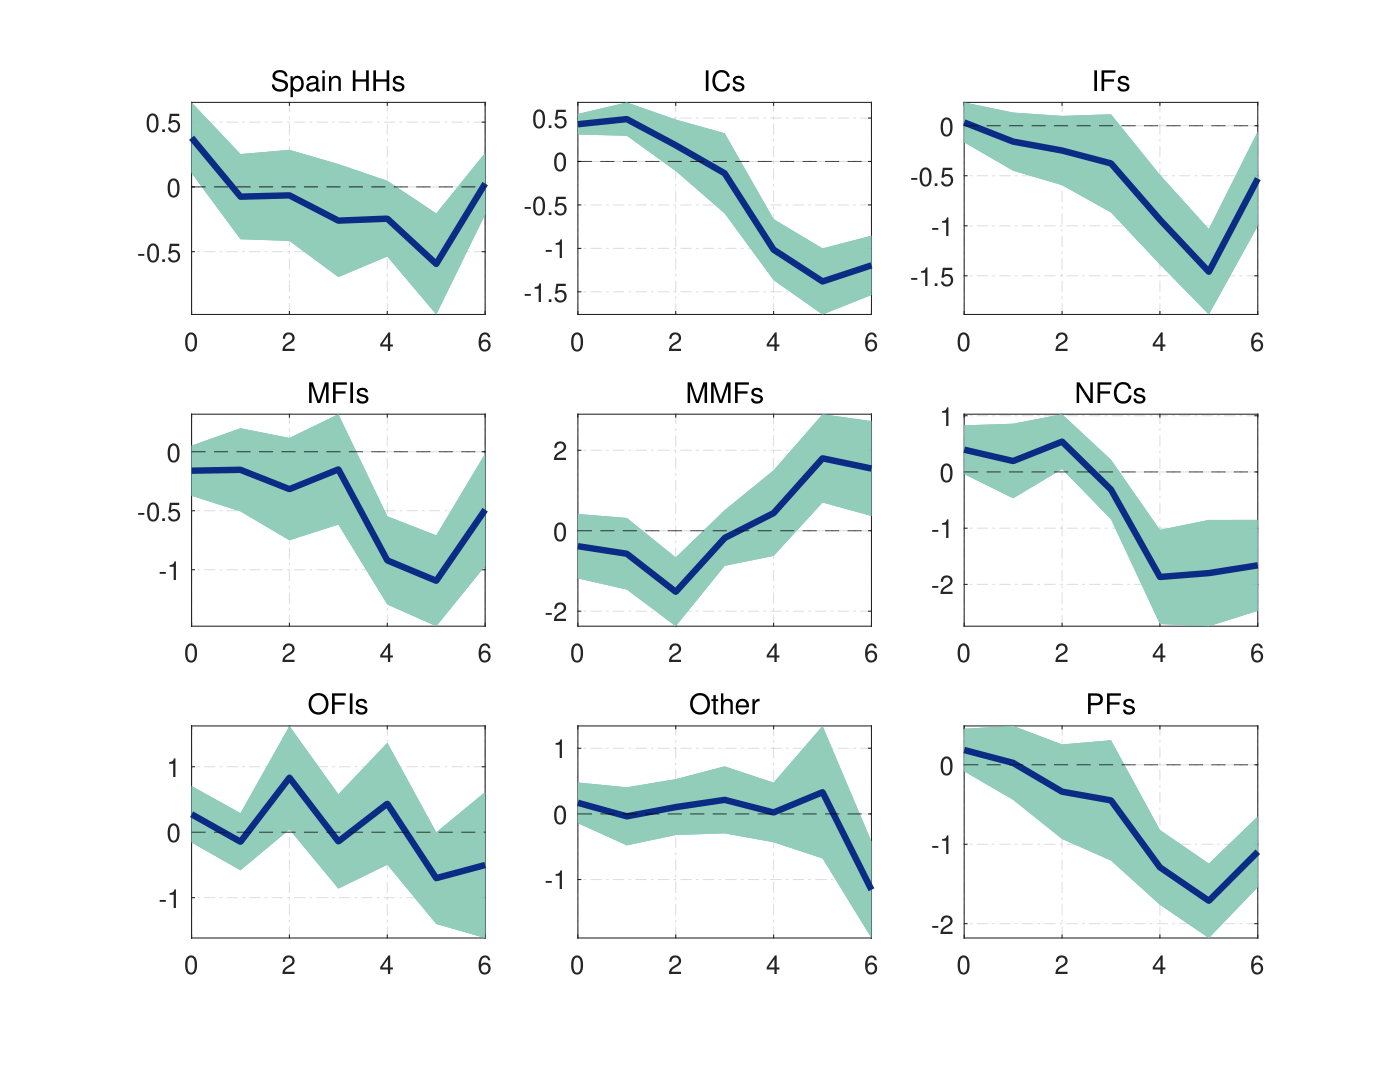
Using granular bond-holding data, the research shows different investor types respond heterogeneously to geopolitical shocks in high-debt euro area countries, with potential fiscal sustainability risks.

Fanfare 2Macro-Finance & RatesOthman Bouabdallah et al.PDF

Spanish sovereign bond holdings responses across investor types to geopolitical shock
Figure 7: Responses of non-domestic Spanish sovereign bond holdings to a geopo- litical risk shock
21

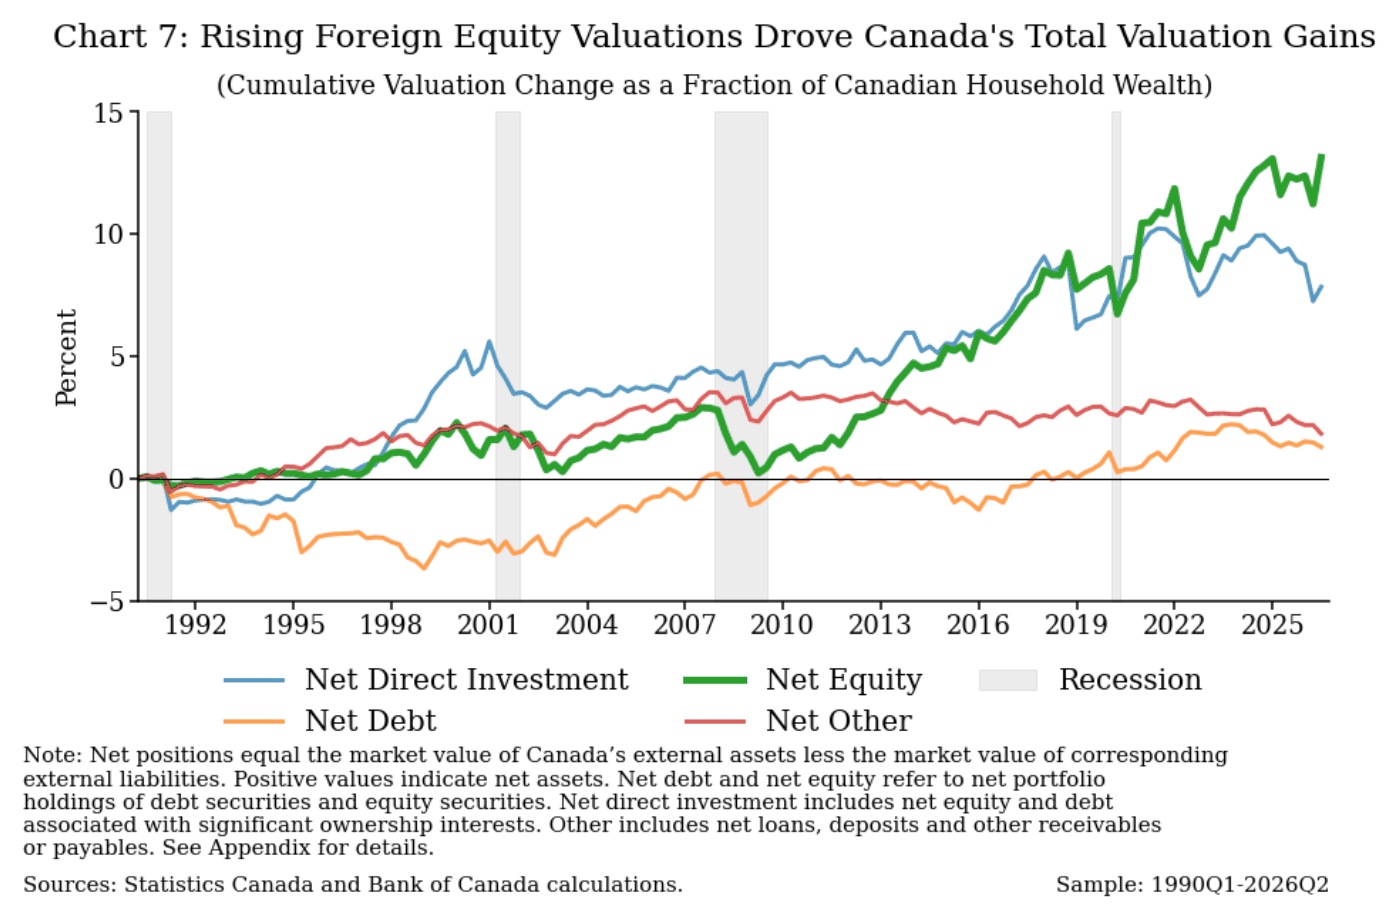
Canada's Cross-Border Carry Trade

The study shows that valuation gains from favorable exchange rates and asset prices have offset Canada's current-account deficits, allowing higher national spending than trade flows alone would permit.

Fanfare 2Macro-Finance & RatesBruno Feunou et al.PDF

Rising foreign equity valuations drive cumulative valuation gains as fraction of household wealth
23

Inflation Forecast Targeting and Fiscal Policy

When central banks target inflation far ahead, stronger policy reactions paradoxically risk indeterminacy unless fiscal policy accommodates, creating potential fiscal dominance.

Fanfare 2Macro-Finance & RatesZeno Enders and Sophia OberbrinkmannPDF

26

Global Imbalances and Financial Spillovers

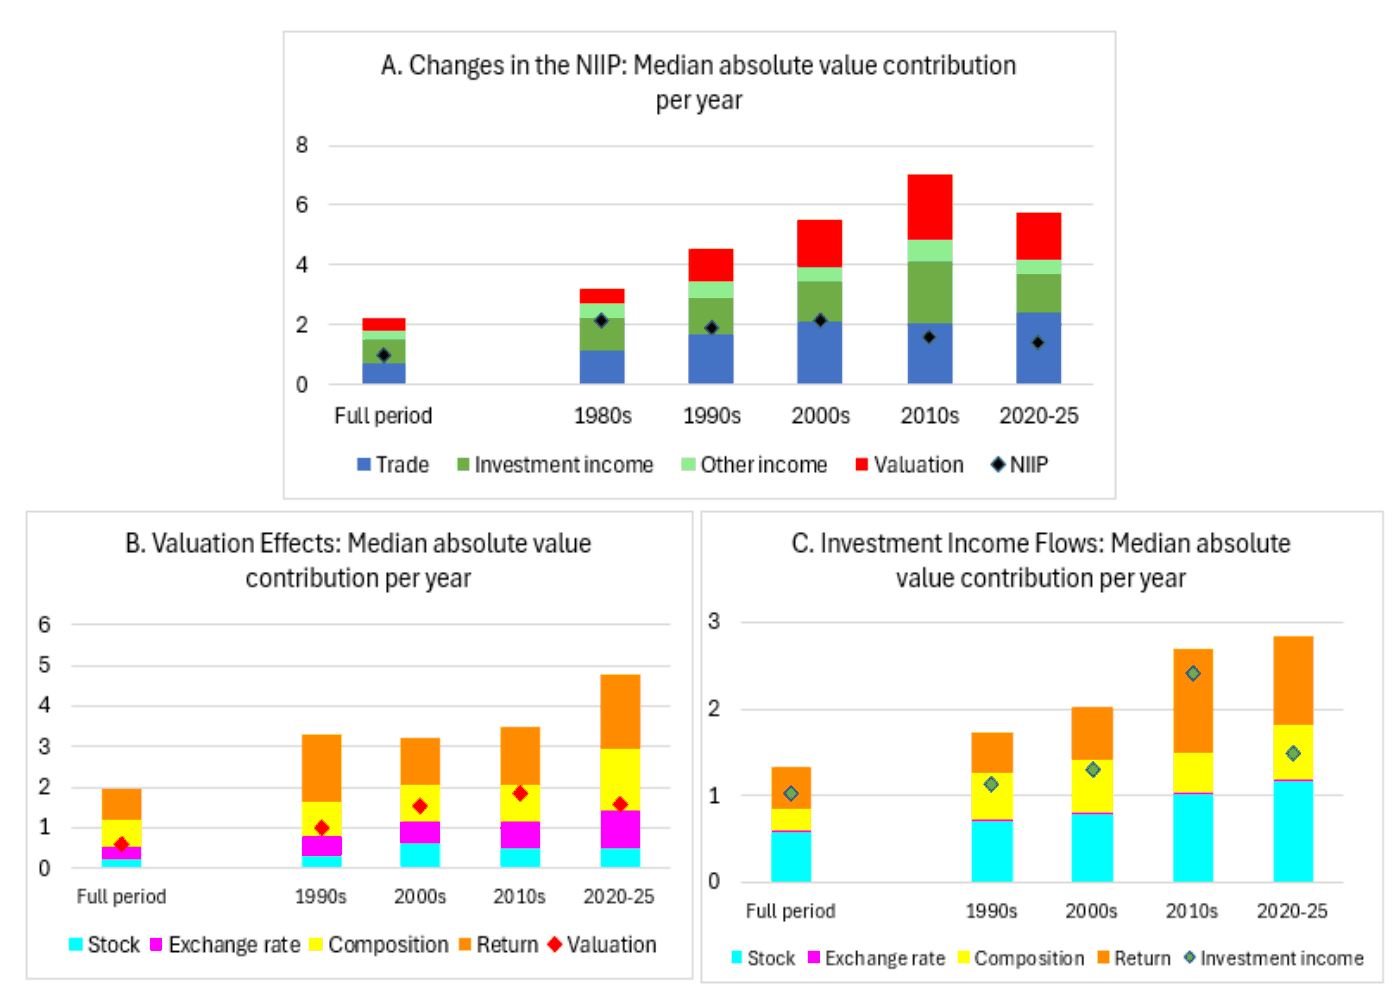
Decomposing global imbalances across 28 economies, the research finds valuation changes are primary drivers and simulates large international spillovers from currency repricing and trade rebalancing.

Fanfare 2Macro-Finance & RatesStefan Avdjiev et al.PDF

Stacked bar charts decomposing NIIP changes into trade, investment income, valuation, and exchange rate effects across time…
Figure 6 Decomposing Changes in the NIIP, Valuation Effects and Investment Income Flows
27

Borrower Age and Mortgage Type Selection

HMDA mortgage data from 2021–2024 reveal that older borrowers, not younger ones, are more likely to choose mortgages with lower monthly payments, particularly balloon-payment loans.

Fanfare 2Macro-Finance & RatesHarman BediPDF

Econometrics & Forecasting5

02

County-Level Consumption from Credit Card Data

A monthly county-level consumption dataset from 350 million credit cards explains 92 percent of national PCE growth variation and captures heterogeneous monetary policy responses.

Fanfare 4Econometrics & ForecastingAditya Aladangady et al.PDF

Monthly national consumption growth comparing credit card spending, adjusted PCE, and retail sales from 2014-2026.
Figure 1: Monthly National Consumption Growth: Official Benchmarks
17

Lifetime Inflation Exposure and Expectations

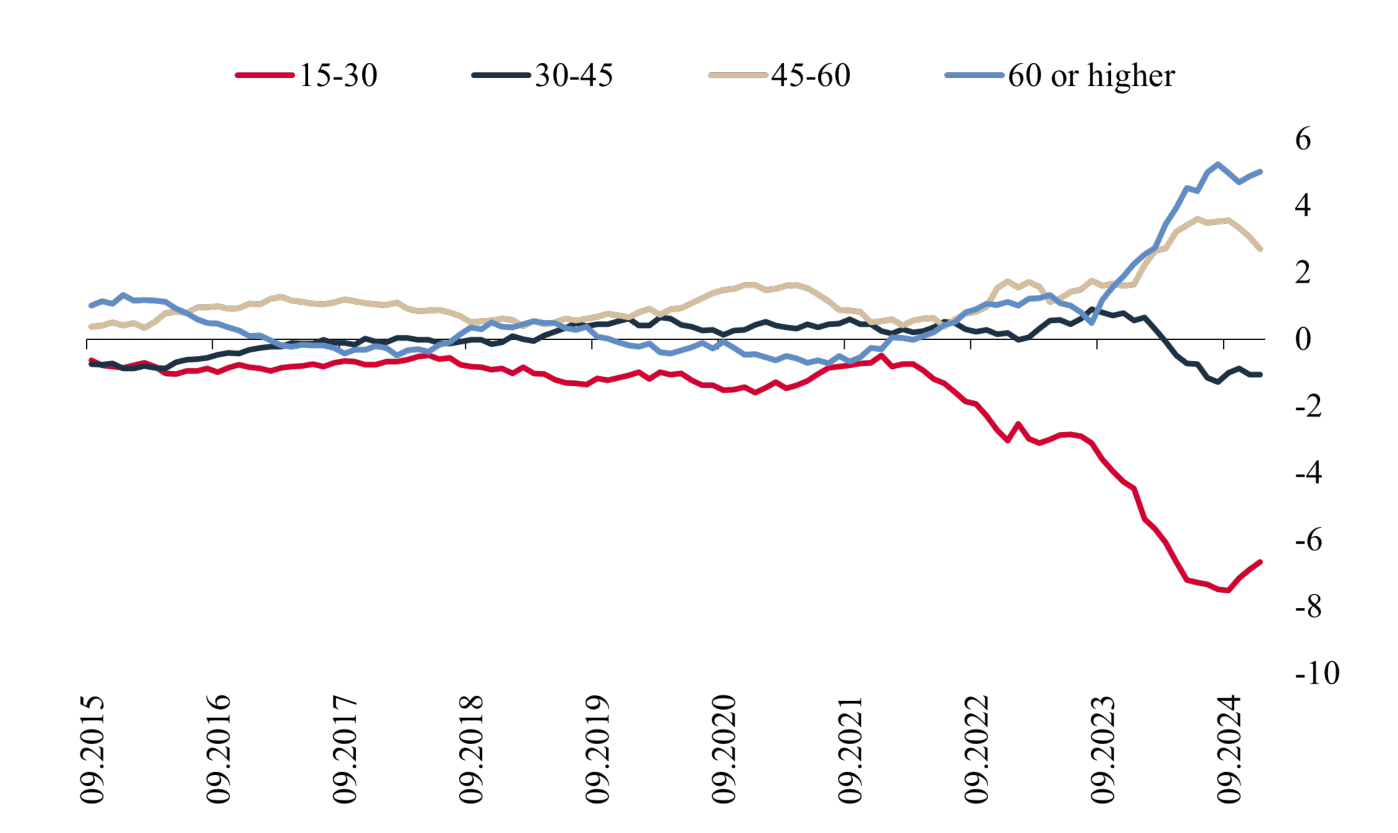
Survey data from Turkey shows that individuals exposed to higher past inflation report higher expected inflation and are more responsive to current price changes, with larger effects among lower-income households.

Fanfare 2Econometrics & ForecastingYusuf Emre Akgunduz et al.PDF

Inflation expectations by age group relative to mean over time, 2015-2024
Figure 1: Inflation Expectations by Age Group Relative to Mean (%)
20

Time-Varying Drivers of Portfolio Flows to Turkey

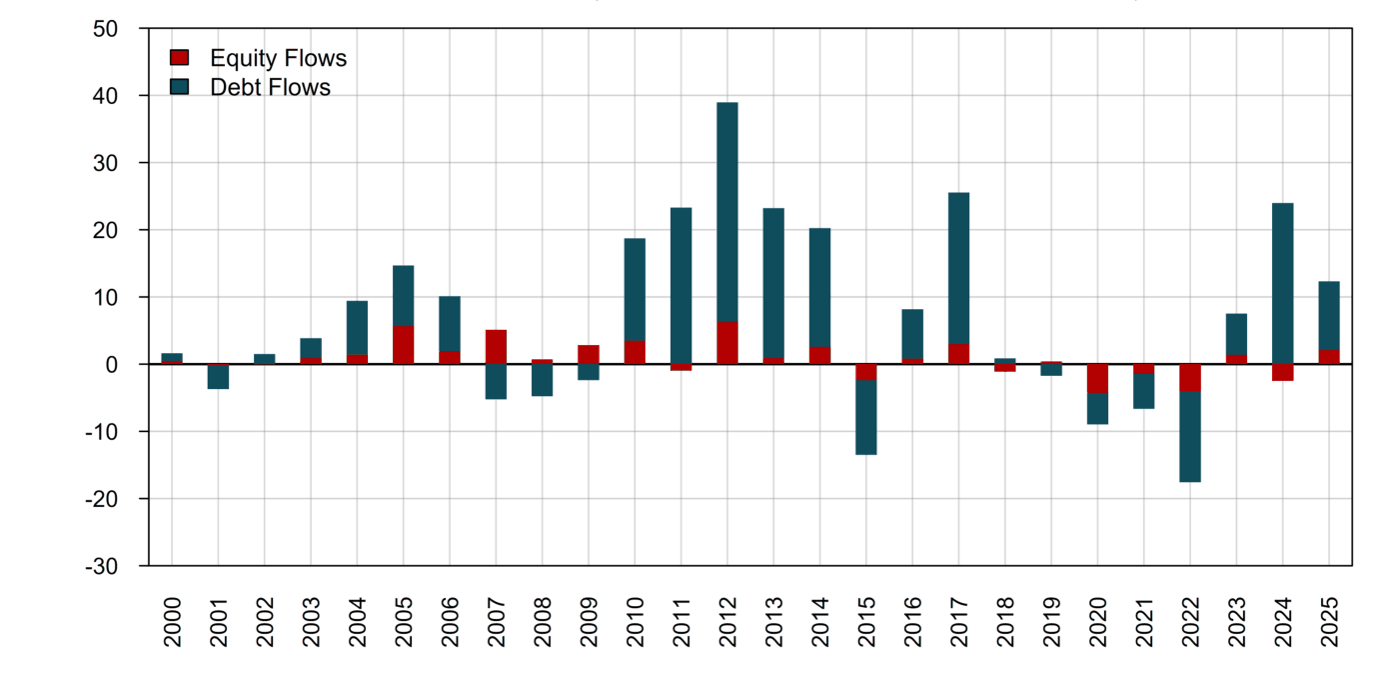
A time-varying VAR model shows that the responsiveness of equity and debt flows to global and domestic shocks has shifted substantially, especially during crises and after 2013.

Fanfare 2Econometrics & ForecastingIrfan Cercil et al.PDF

Stacked bar chart of annual equity and debt portfolio flows to Turkey from 2000-2023
Figure 1: Portfolio Flows to T¨urkiye (Billion USD, Annual Net Aggregates)
22

US-China Tensions and Renewable Energy

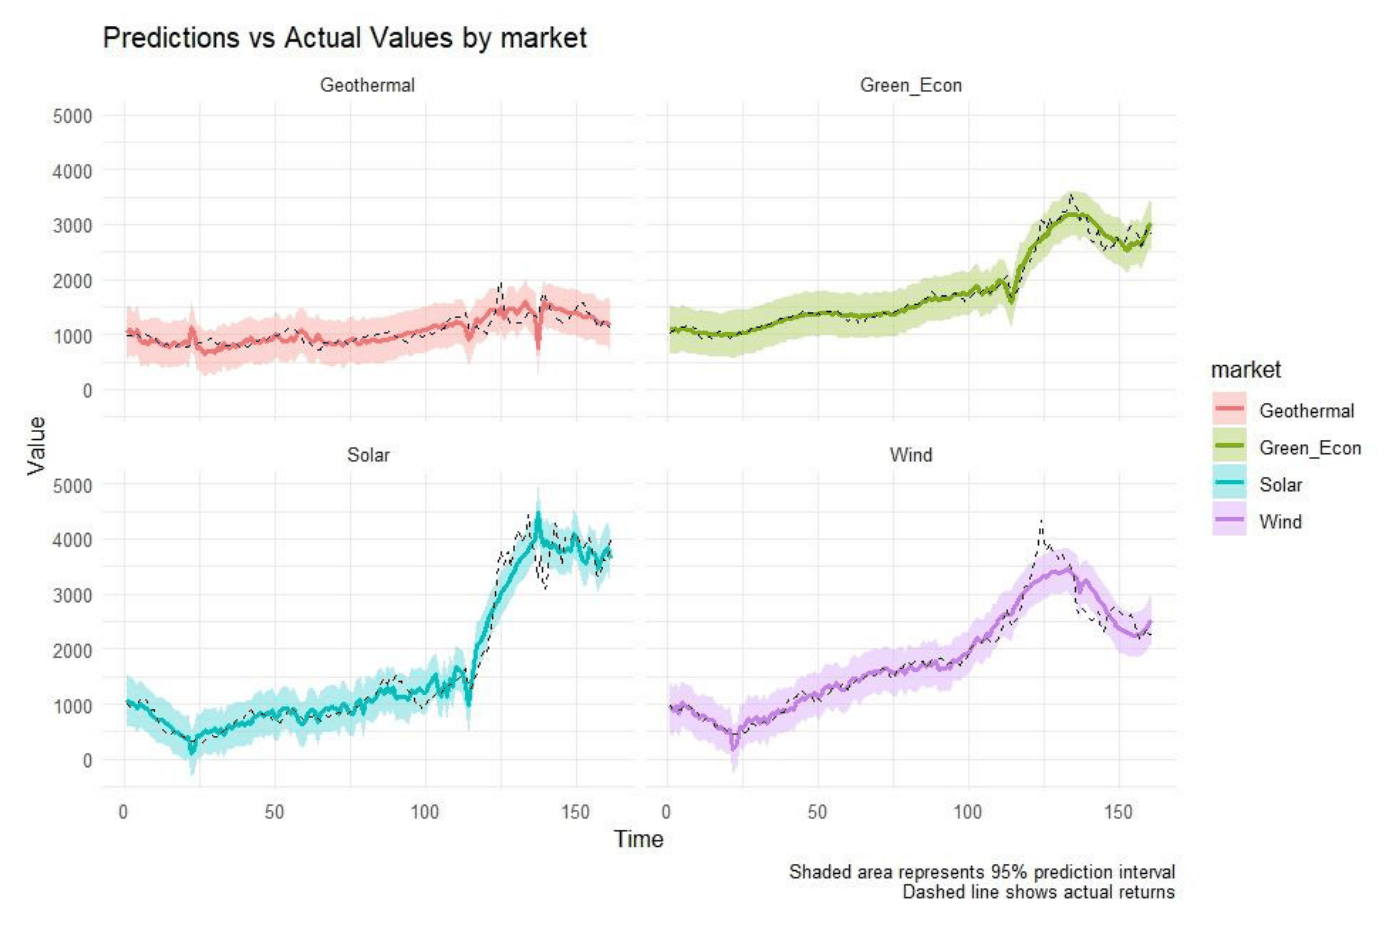
Using Bayesian inference, the research reveals that renewable energy sectors respond heterogeneously to trade tensions, with some developing resilience mechanisms against geopolitical shocks.

Fanfare 2Econometrics & ForecastingBabak Naysary and Abdul GhafoorPDF

Predictive performance of Bayesian models
Figure 3. Predictive performance of Bayesian models.
25

Survey Wording and Inflation Expectations

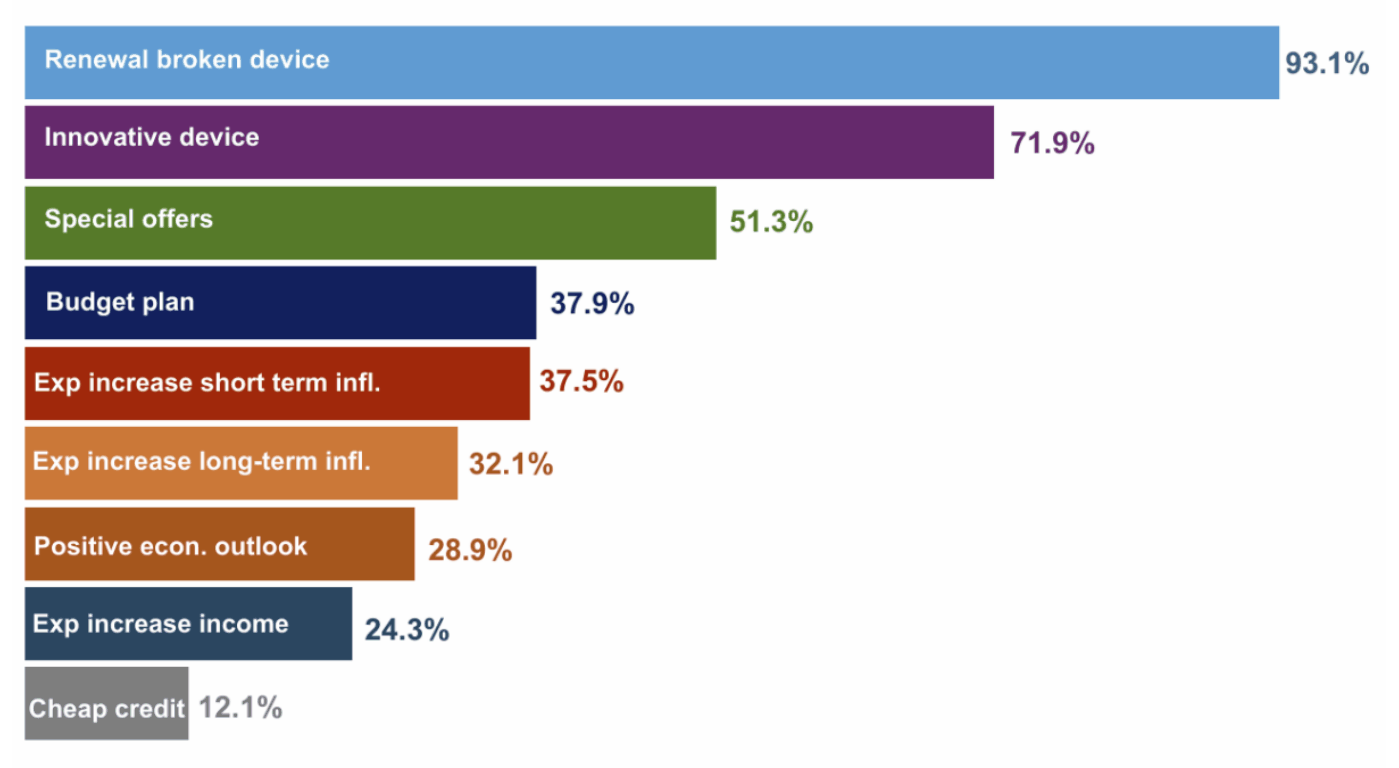
The paper demonstrates that survey question phrasing determines whether inflation expectations reduce spending, with attitude questions yielding negative effects and past-spending questions yielding insignificant results.

Fanfare 2Econometrics & ForecastingTiziana Assenza et al.PDF

When and why do people make major purchases?
Figure 1: When and why do people make major purchases?

Asset Pricing & Factors5

03

Asset Pricing with Heterogeneous Agents Under Limited Information

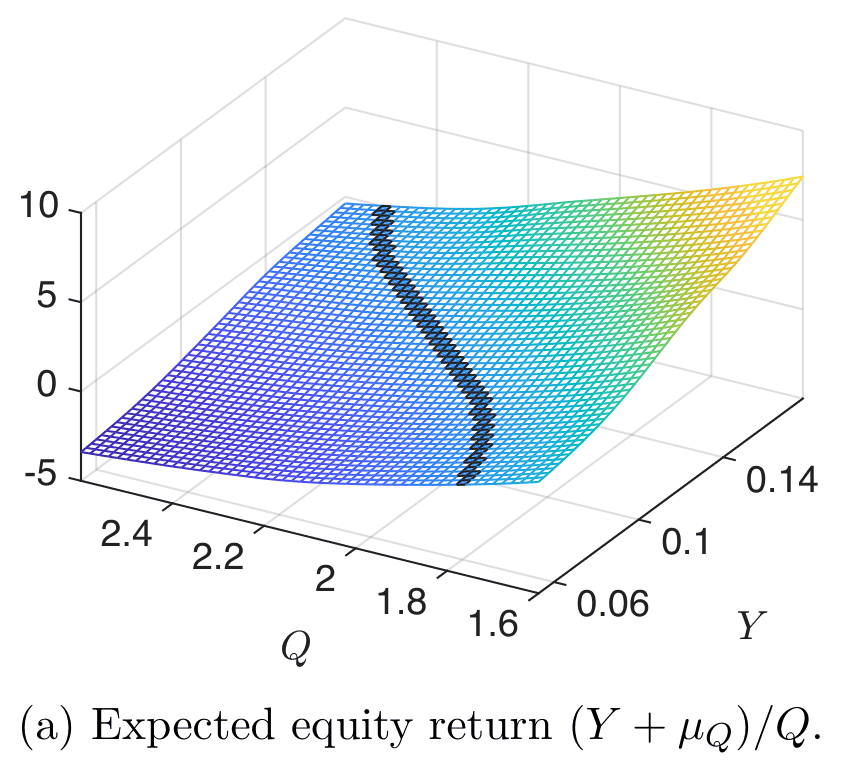
The study develops a tractable framework for heterogeneous agents with endogenous portfolios and finds that nonlinear volatility creates time-varying risk premia that link wealth inequality to asset returns.

Fanfare 3Asset Pricing & FactorsRiccardo A. Cioffi et al.PDF

3D surface plot showing expected equity return varying across dividend and price states
Figure 7: Expected equity return and risk premium over the aggregate state (Y, Q).
04

Spatial Heterogeneity in Housing Returns Across Cities

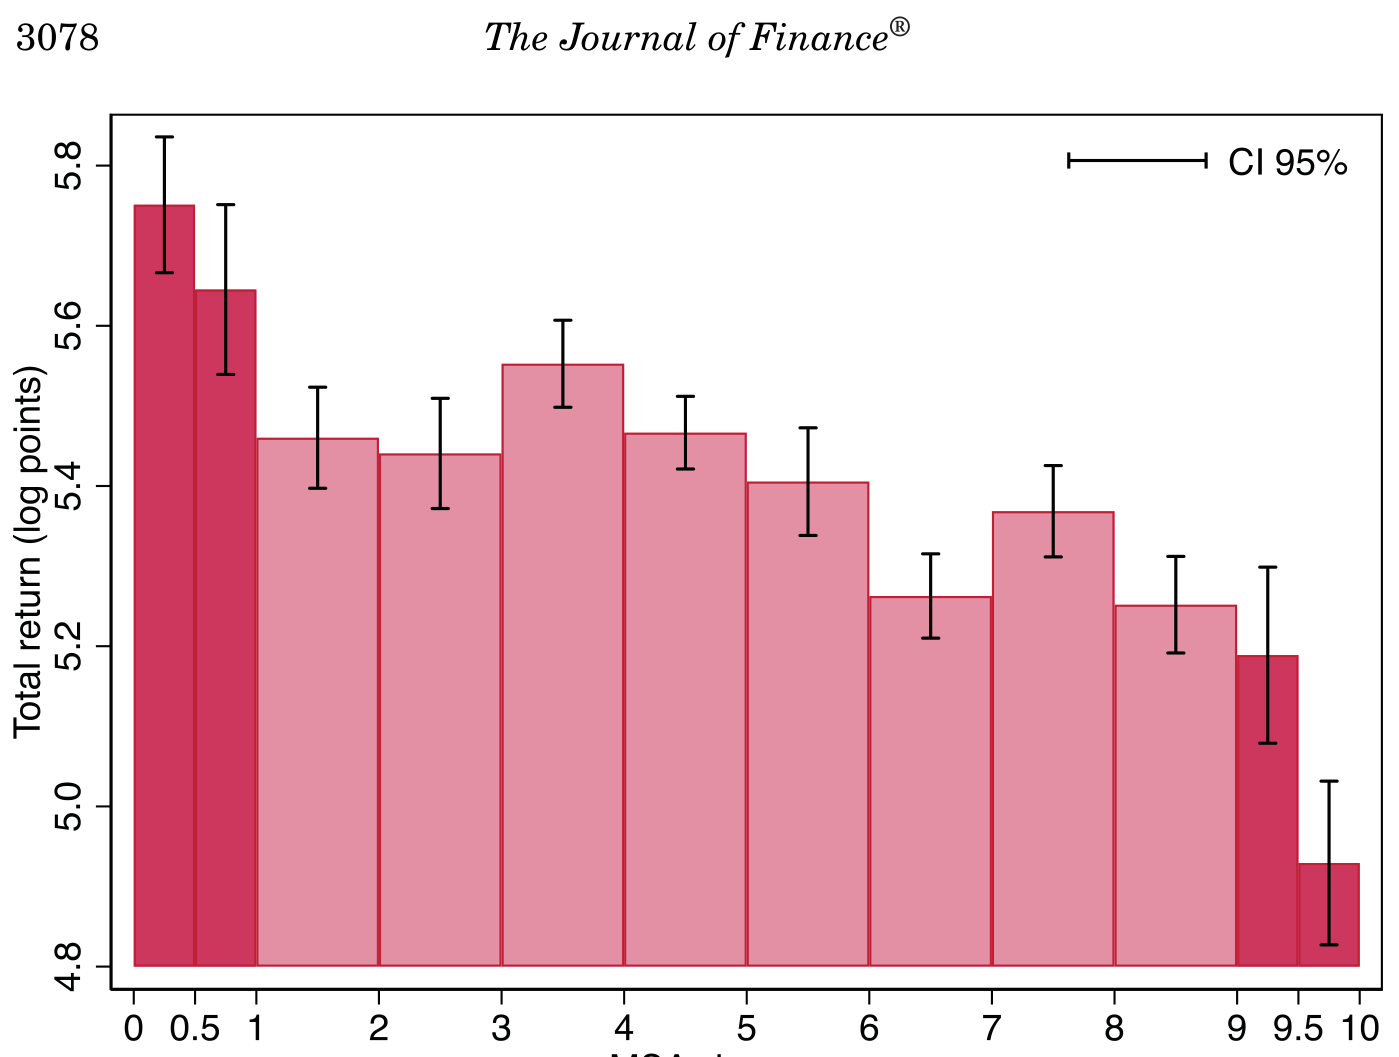
Analysis of 15 OECD countries over 150 years finds total returns in large agglomerations are about 100 basis points lower annually than elsewhere, explained by income covariance and liquidity differences.

Fanfare 3Asset Pricing & FactorsFrancisco Amaral et al.PDF

Total housing returns by city population size, 1950-2018, showing declining returns with larger cities.
Figure 5. Total returns for 316 MSAs (log points) by population size, 1950–2018. All re- turns are log returns. Cities are divided into bins based on the size of the MSA…
09

M&A Spillovers in Digital Platforms

Event study of 889 announcements by tech giants shows direct competitors show no systematic response, but ecosystem-wide rivals co-move through shared infrastructure and governance interdependencies.

Fanfare 3Asset Pricing & FactorsSamuel Keil et al.PDF

18

Fiscal Deficits and US Asset Prices

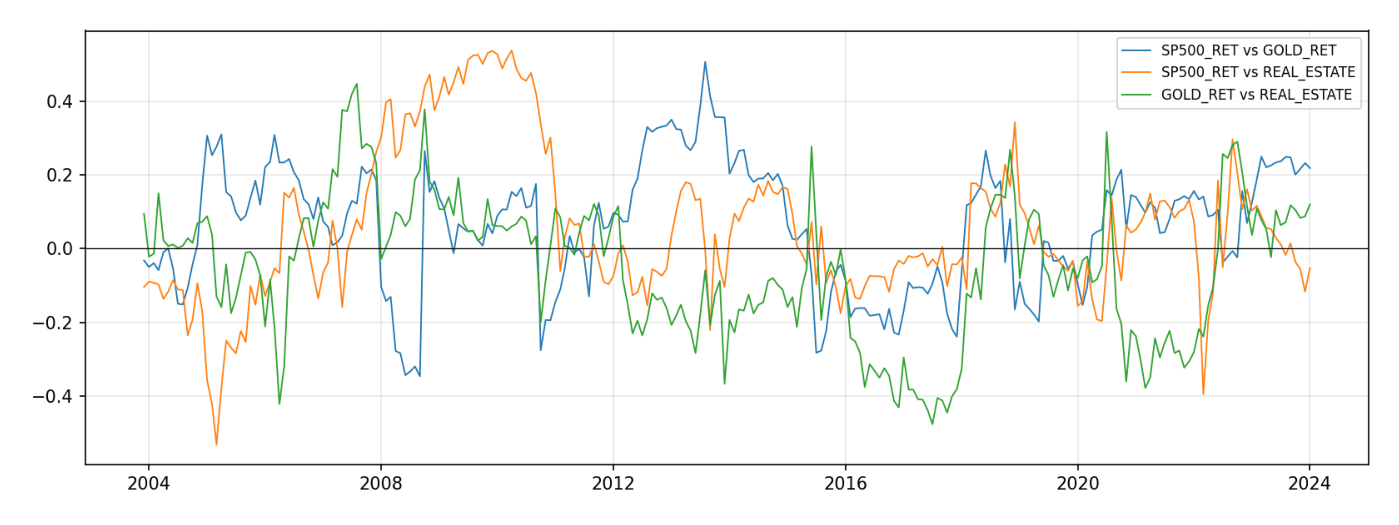
A VAR analysis finds deficit shocks raise S&P 500 prices by 1.97% and house prices by 0.55% on average over twelve months, but the relationship is unstable after 2009.

Fanfare 2Asset Pricing & FactorsJorge Aníbal Restrepo-Morales et al.PDF

Rolling correlations of 24 months between asset returns, January 2002 to January 2024
Figure 4. Rolling correlations of 24 months between asset returns, January 2002 to January 2024.
19

Credit Shocks, Housing, and Rental Markets

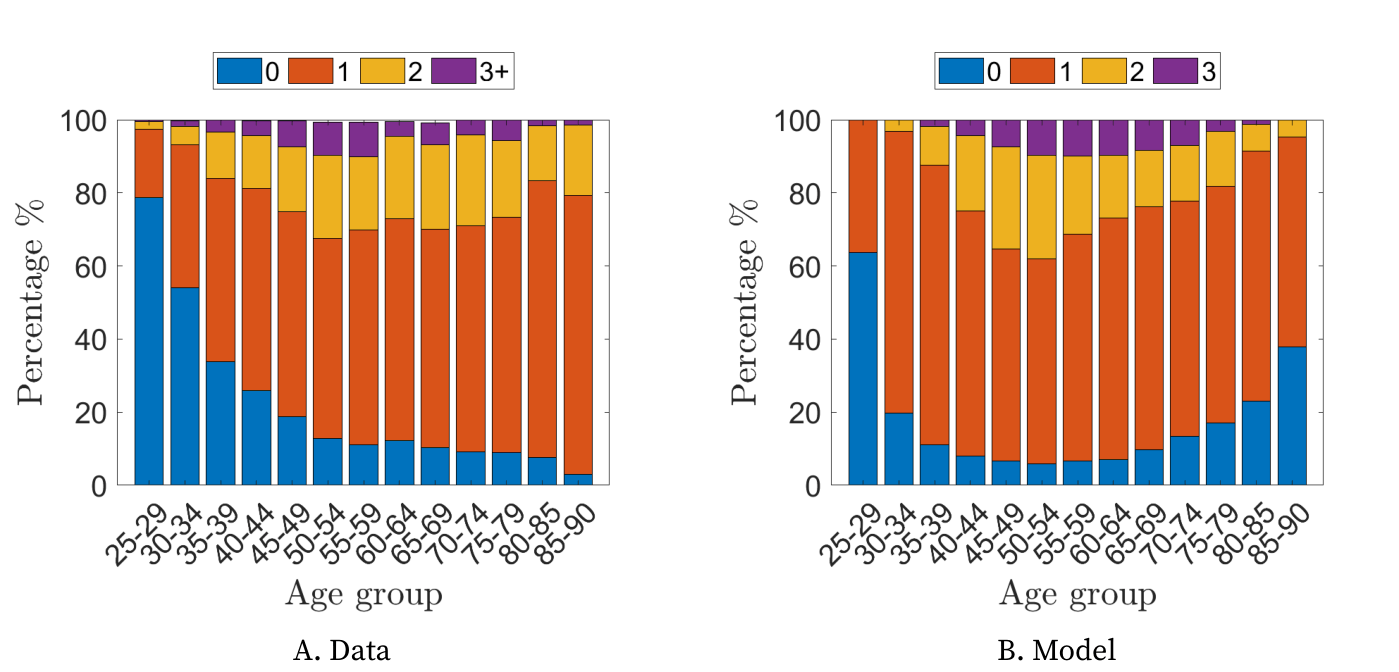
A model of Ireland's housing and rental markets shows contractionary credit shocks reduce house prices but increase rents, exposing distributional effects of macroprudential policy.

Fanfare 2Asset Pricing & FactorsJuan Castellanos et al.PDF

Number of properties along the life-cycle
FIGURE 4. Number of properties along the life-cycle

Risk, Credit & Banking4

05

Financial Barriers to Green Technology Innovation

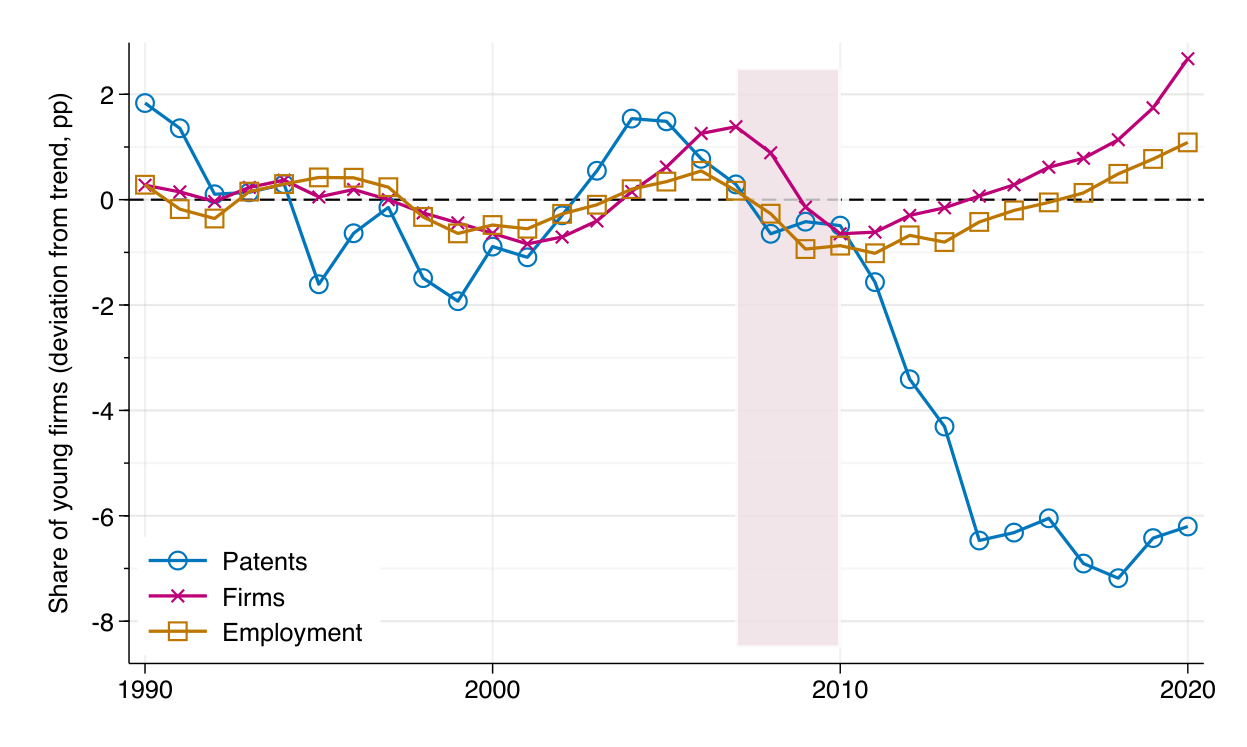
A Schumpeterian model and German patent data show that young firms self-select into emerging technologies and are more financially constrained, so credit shocks disproportionately slow green innovation.

Fanfare 3Risk, Credit & BankingPhilippe Aghion et al.PDF

Share of patents, firms and employment from young firms
Figure B3. Share of patents, firms and employment from young firms
11

Global Financial Conditions and Philippine Firm Debt

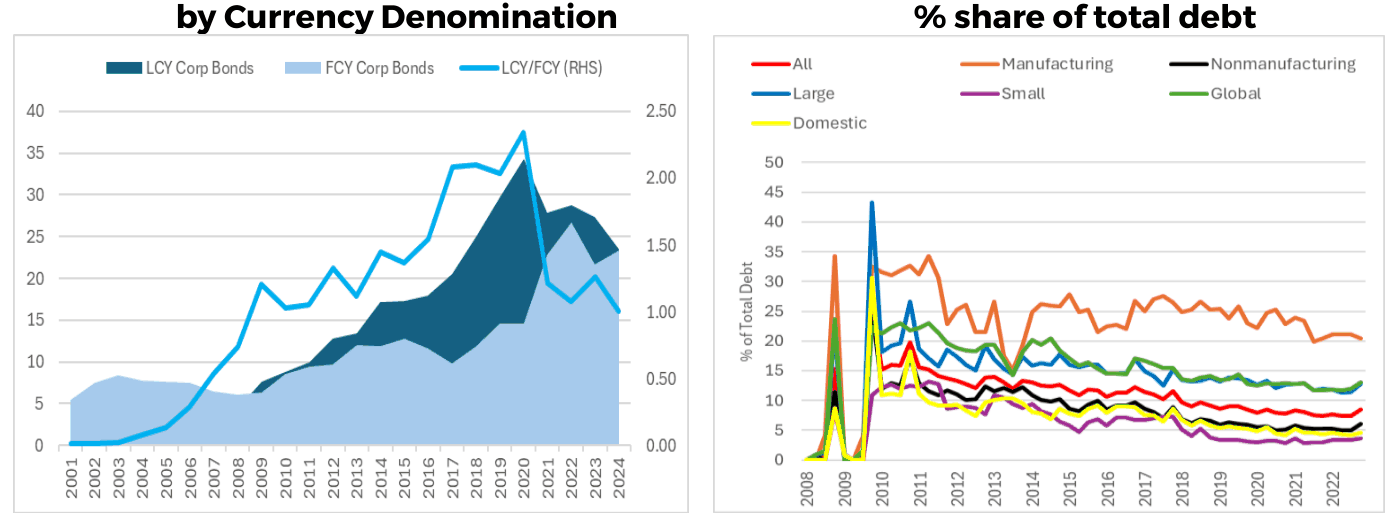
Tighter global financial conditions reduce foreign currency debt relative to domestic debt among Philippine firms, with performance effects varying by shock source and pre-existing FX exposure.

Fanfare 2Risk, Credit & BankingHazel C. Parcon-Santos et al.PDF

Foreign currency debt and domestic debt share trends for Philippine firms over time
Figure 2a. Corporate Bonds Outstanding, Figure 2b. Listed Firms’ FX debt,
12

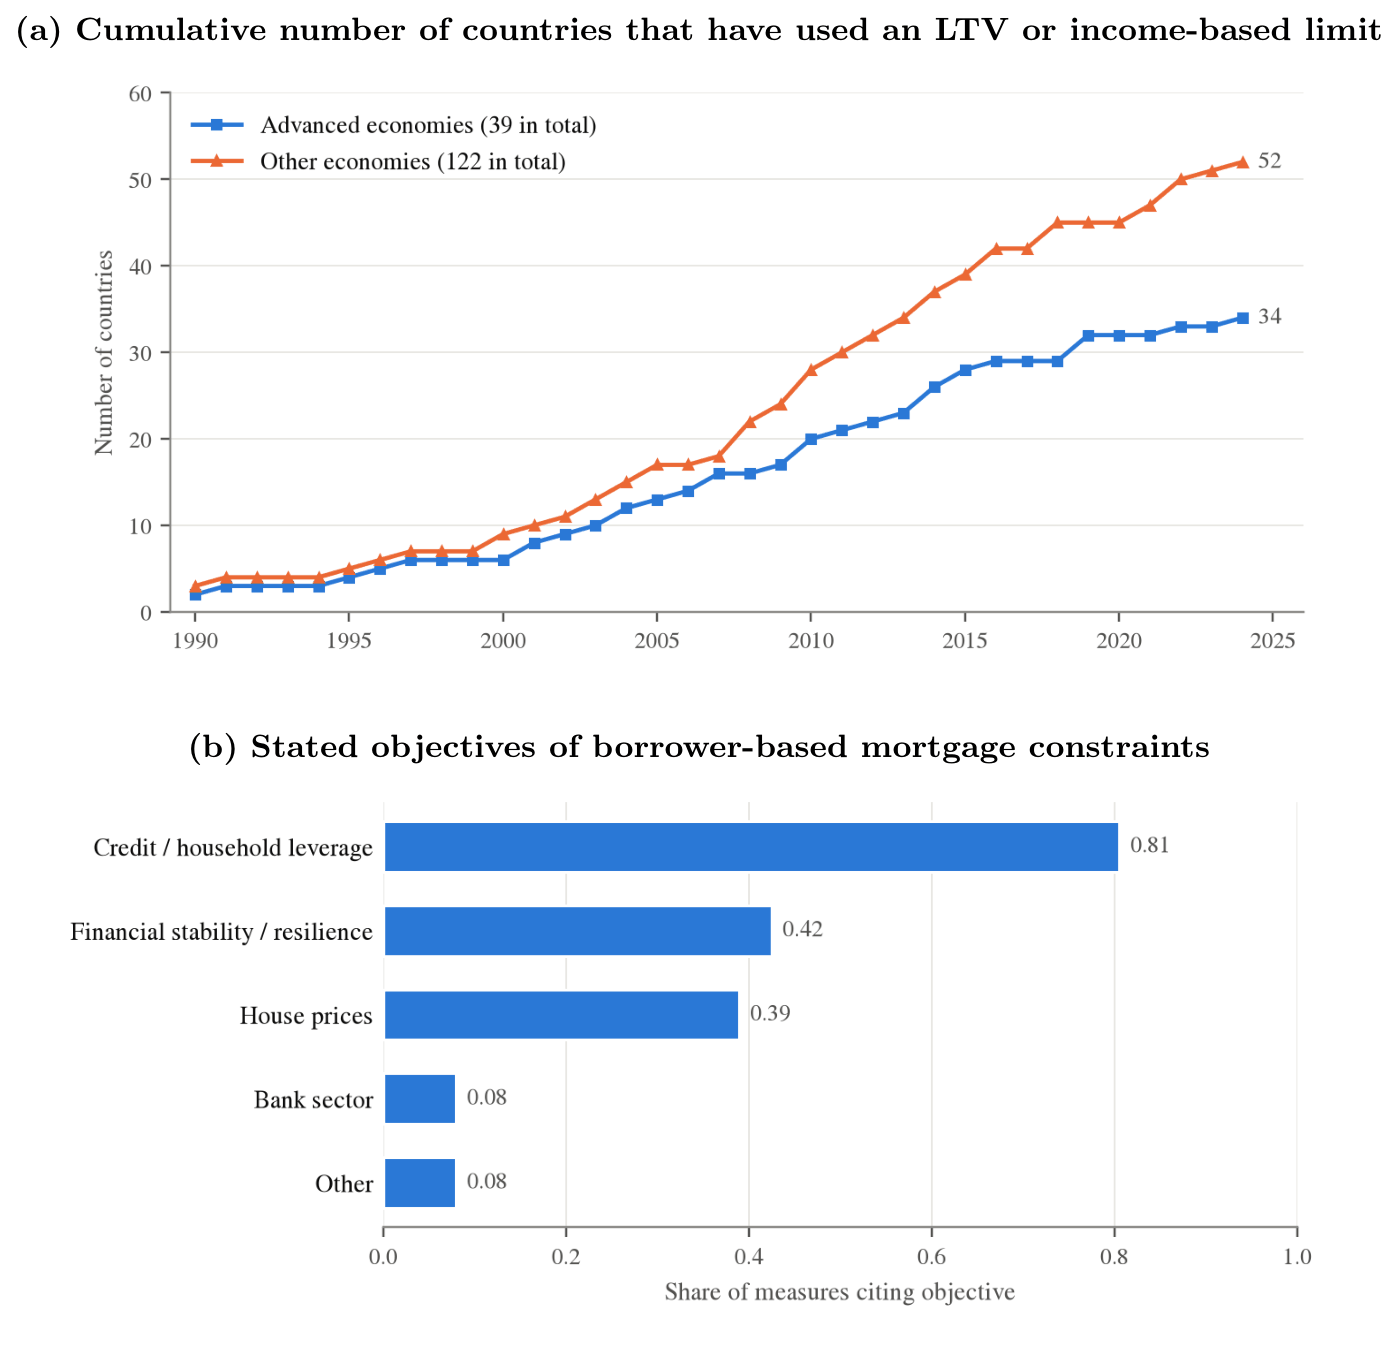
Mortgage Constraints and Household Financial Vulnerability

Mortgage tightening directly harms young and low-wealth households through fewer originations; aggregate credit responses amplify micro effects, but evidence on corrective benefits remains scarce.

Fanfare 2Risk, Credit & BankingClaes Bäckman et al.PDF

Adoption and stated objectives of mortgage constraints
Figure 1: Adoption and stated objectives of mortgage constraints
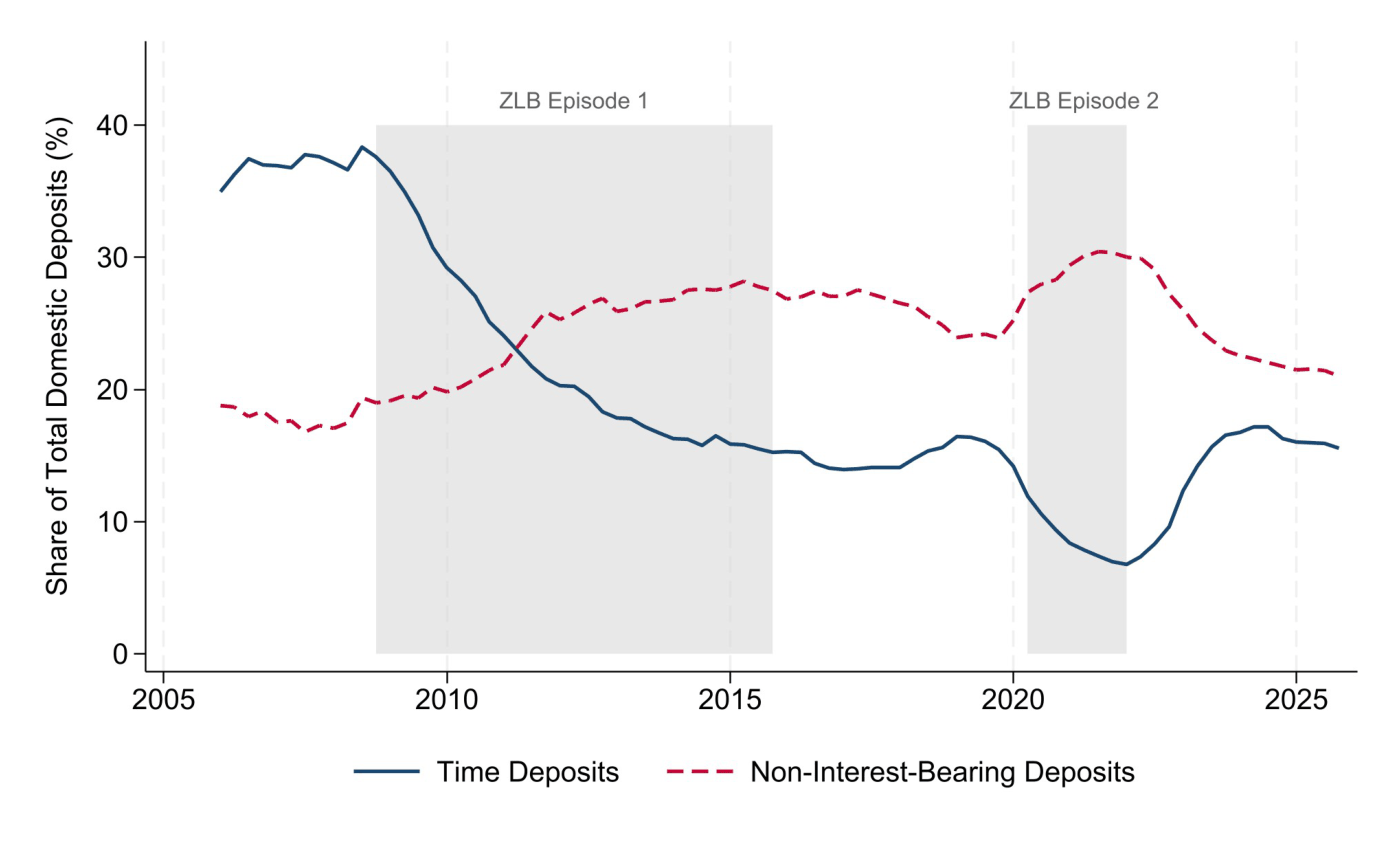
13

Unconventional Monetary Policy and Deposit Stability

Zero rates and quantitative easing drew rate-sensitive large depositors, increasing flow sensitivity and deposit beta upon normalization, raising costs and risks for banks.

Fanfare 2Risk, Credit & BankingPhilip Strahan and Tuo YangPDF

Time deposits and non-interest-bearing deposits share divergence, 2005-2025

Portfolio & Allocation3

06

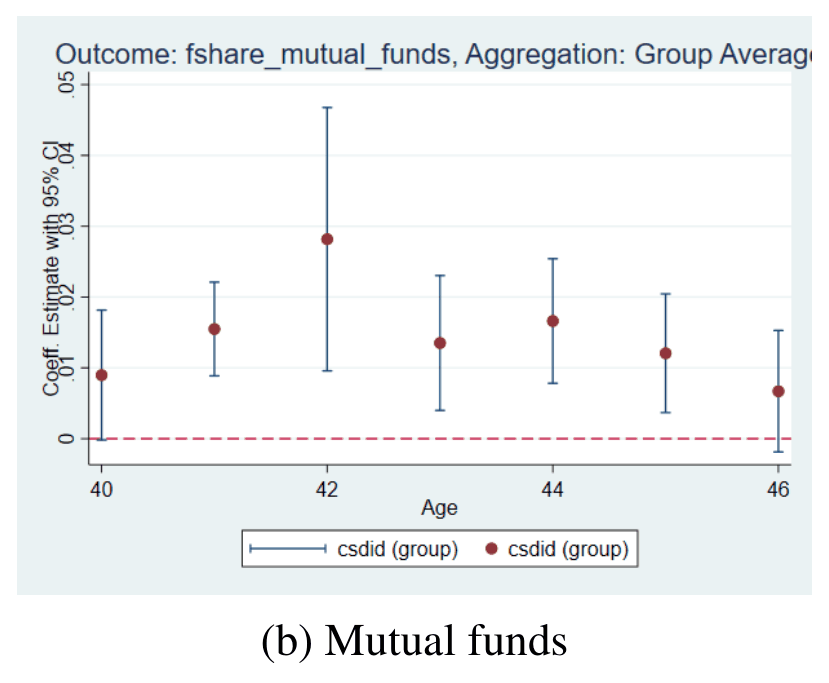
Business Education and Portfolio Risk Taking

Staggered college openings in Norway reveal that short business programs durably raise risky asset participation and allocations without materially changing income or leverage.

Fanfare 3Portfolio & AllocationFenella Carpena et al.PDF

Mutual fund share of financial wealth by age, showing treatment effect with confidence intervals.
Figure C3: Risky asset shares of financial wealth (all components)
08

Carbon Regulation and European Airline Competition

A structural model of airline competition finds rising EU carbon prices sharply cut consumer surplus overall, but shift profits and welfare effects asymmetrically across route lengths and carriers.

Fanfare 3Portfolio & AllocationErtian Chen et al.PDF

24

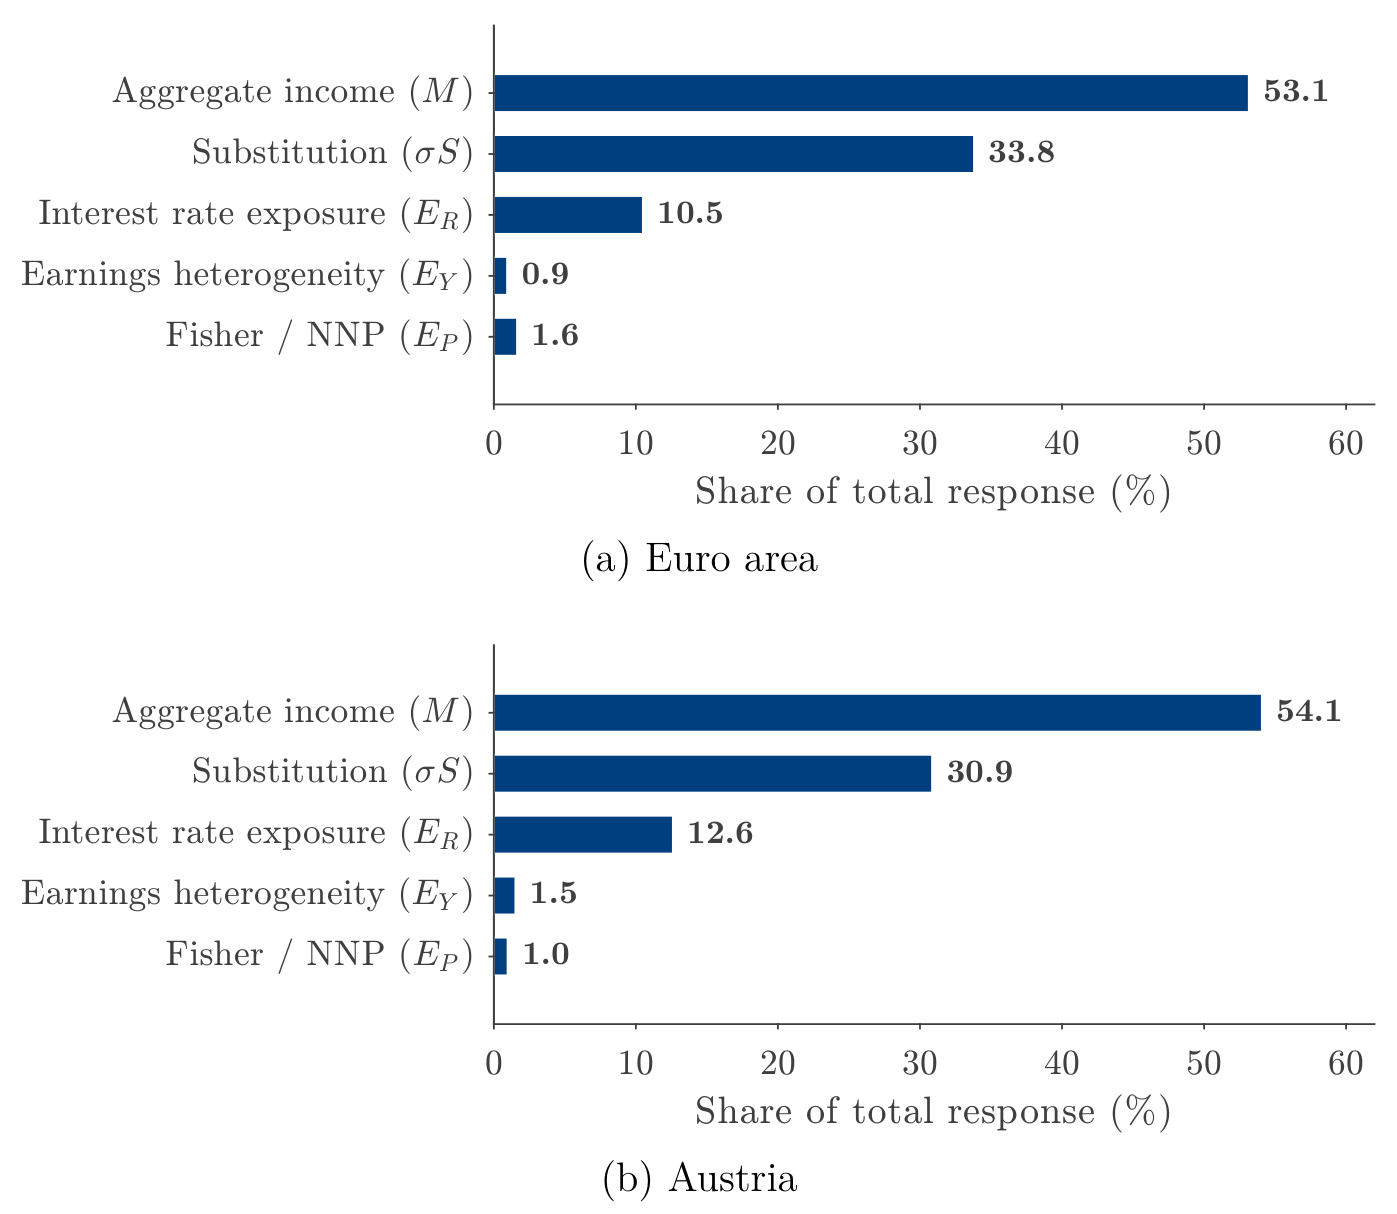
Household Heterogeneity and Monetary Policy

Extending monetary policy analysis to open economies, the study finds household redistribution and foreign asset exposure amplify consumption responses to rate cuts by 17.5 percent.

Fanfare 2Portfolio & AllocationAtanas Pekanov et al.PDF

Monetary policy transmission channels comparing euro area and Austria by share of response.
Figure 4: Contributions of monetary policy transmission channels

Trading, Microstructure & Execution2

10

Short Sales and Off-Exchange Liquidity Provision

Liquidity-providing dark short sales are largely uninformed and facilitate trading, yet increased dark liquidity reduces lit exchange liquidity and raises overall trading costs.

Fanfare 2Trading, Microstructure & ExecutionSebastian Schlie et al.PDF

Cumulative Response of Return to Off-Exchange Volume Shocks
Figure 5: Cumulative Response of Return to Off-Exchange Volume Shocks. The figure shows equally weighted cumulative impulse response functions of mid-quote log returns (…
16

Exchange-Rate Regimes and Exporter Behavior

Analysis of European car-maker pricing reveals that floating regimes trigger markup and marginal-cost cuts that absorb exchange-rate moves, explaining why regimes are largely neutral for real outcomes.

Fanfare 2Trading, Microstructure & ExecutionCosimo Petracchi et al.PDF

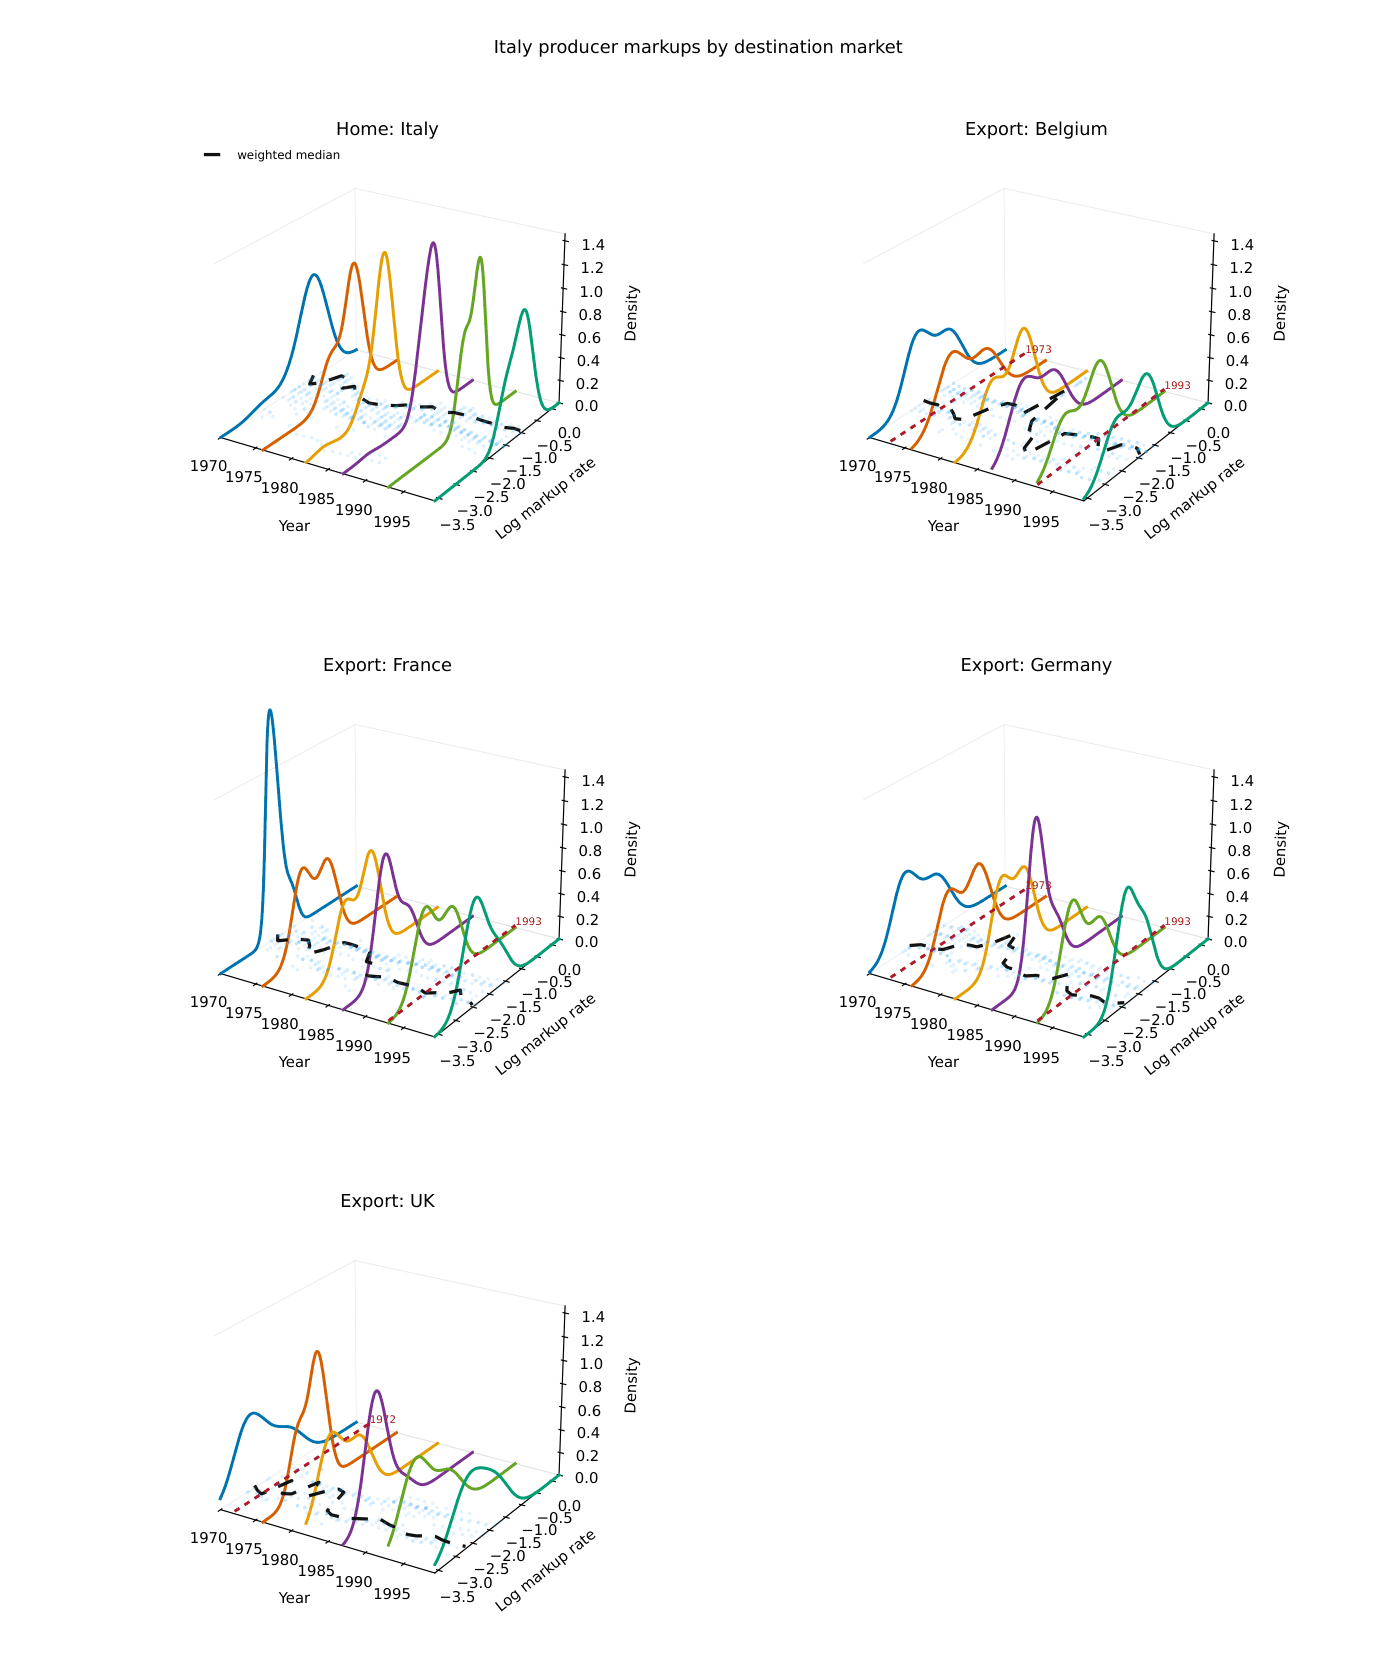
Markup distribution of cars produced in Italy
Figure 2: Markup distribution of cars produced in Italy

Crypto & DeFi2

28

Divisia Aggregation with Stablecoins

The paper extends monetary aggregation theory to include stablecoins, showing that user costs vary by jurisdiction and friction premiums explain strong demand despite high certainty-equivalent costs.

Fanfare 2Crypto & DeFiWilliam A. Barnett and Jinan LiuPDF

30

Bitcoin Adoption and Capital Flows

Analysis of El Salvador's Bitcoin adoption finds that official cross-border financial activity fell afterward, suggesting unrecorded transfers replaced formal channels.

Fanfare 2Crypto & DeFiStefan Goldbach and Volker NitschPDF

Also notable2

14

IPO Decisions and Capital Access

Firms with higher external capital needs go public to access expanded lending pools on better terms, maintaining pre-IPO leverage while increasing investment and debt issuance.

Fanfare 2Corporate FinanceAndres Almazan et al.PDF

Syndicated Bank Loan Dynamics
Figure 10: Syndicated Bank Loan Dynamics
29

XAI Bankruptcy Prediction with Climate Risk

Using explainable AI with climate risk variables, the study predicts corporate failure with high accuracy and finds climate effects on liquidation risk vary significantly across French sectors.

Fanfare 2ML & AI MethodsNicolae Stef et al.PDF

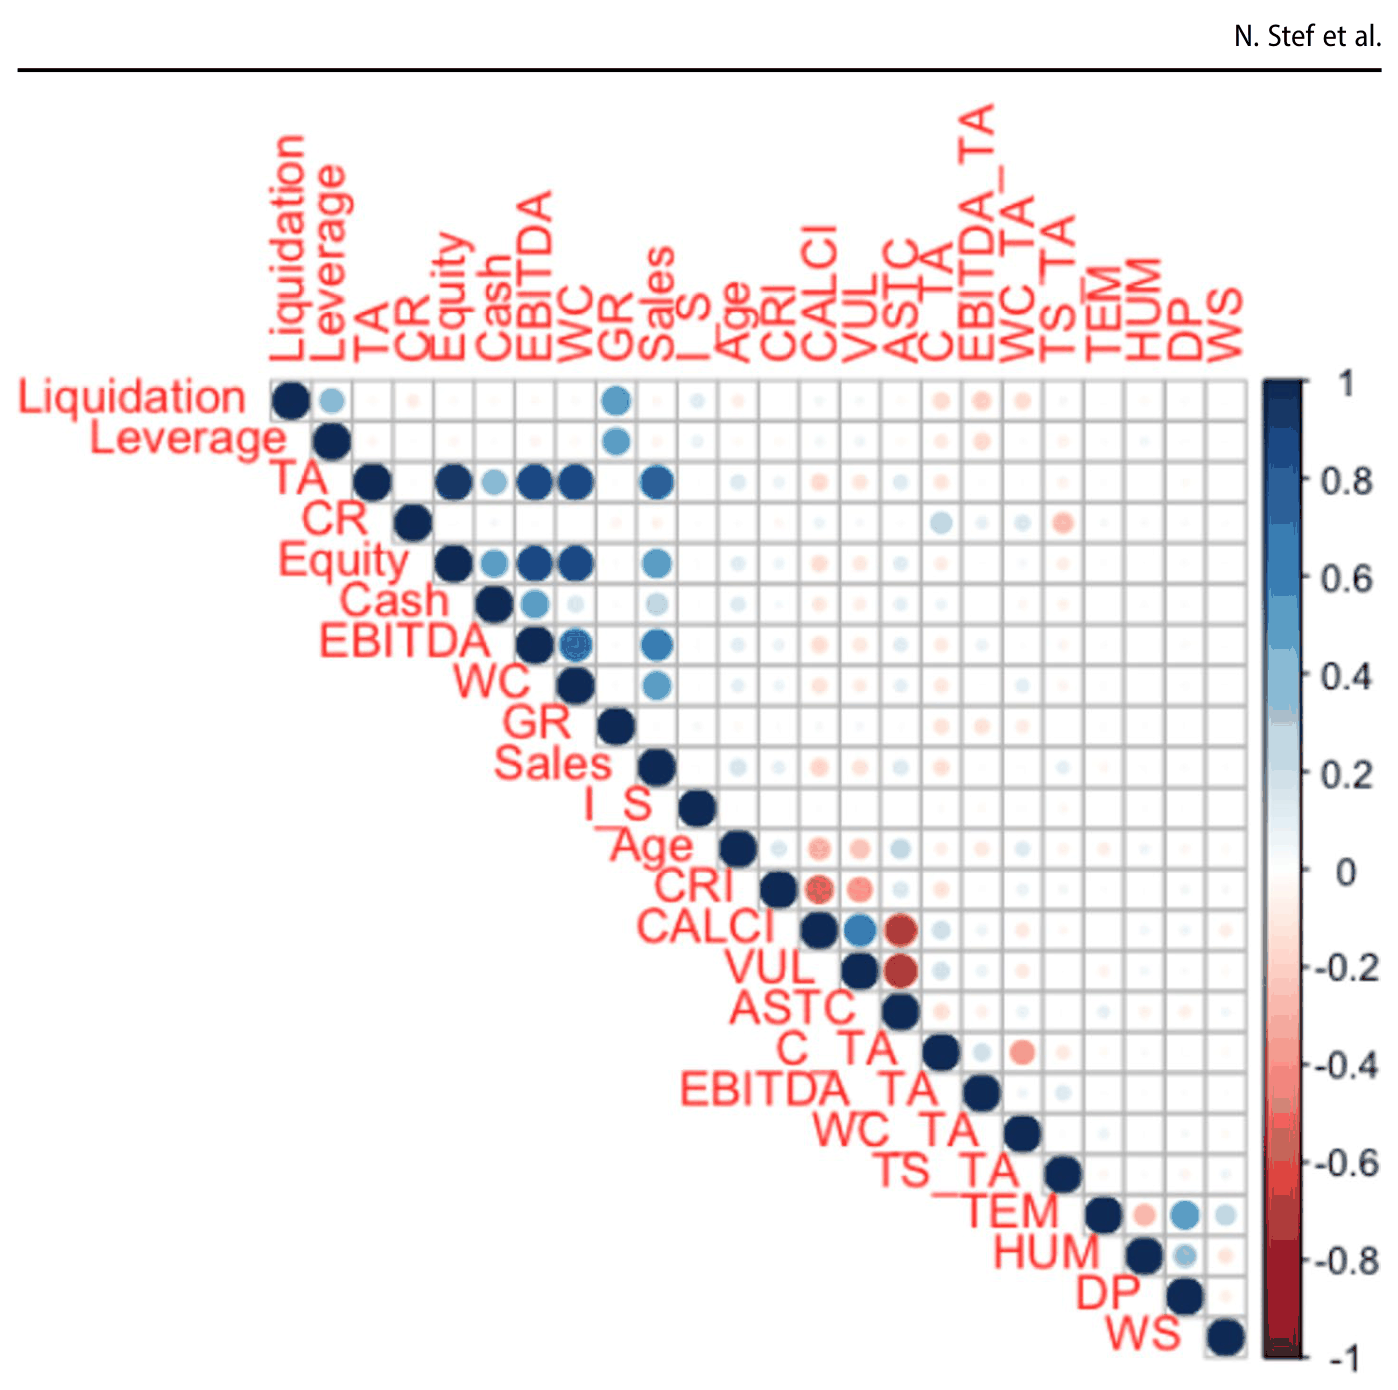
Correlogram plot of all predictors
Fig. 1 Correlogram plot of all predictors

Read the paperOpen full-size image

    Type to search. Try rough volatility, LLM agents or FinGPT.

    ↑↓ move↵ openesc closeFull search page