The Logic of Factor Portfolios: Boolean Rules, Interactions, and Trading Costs
Walsh decomposition reveals how interactions among signals drive turnover and persistence; most single-signal portfolios beat quoted spreads but few multi-signal combinations do.
Featured in No. 139 on 13 Nov 2026 · 4 days after release
- Released
- 9 Nov 2026
- First featured
- No. 139 · 13 Nov 2026
- Published in
- Not yet, as far as Semantic Scholar knows
- Fanfare
- 3 of 5
- Identifier
- arXiv:2611.09834
- Authors
- Ziyao Wang et al.
Abstract
From arXiv (CC0).
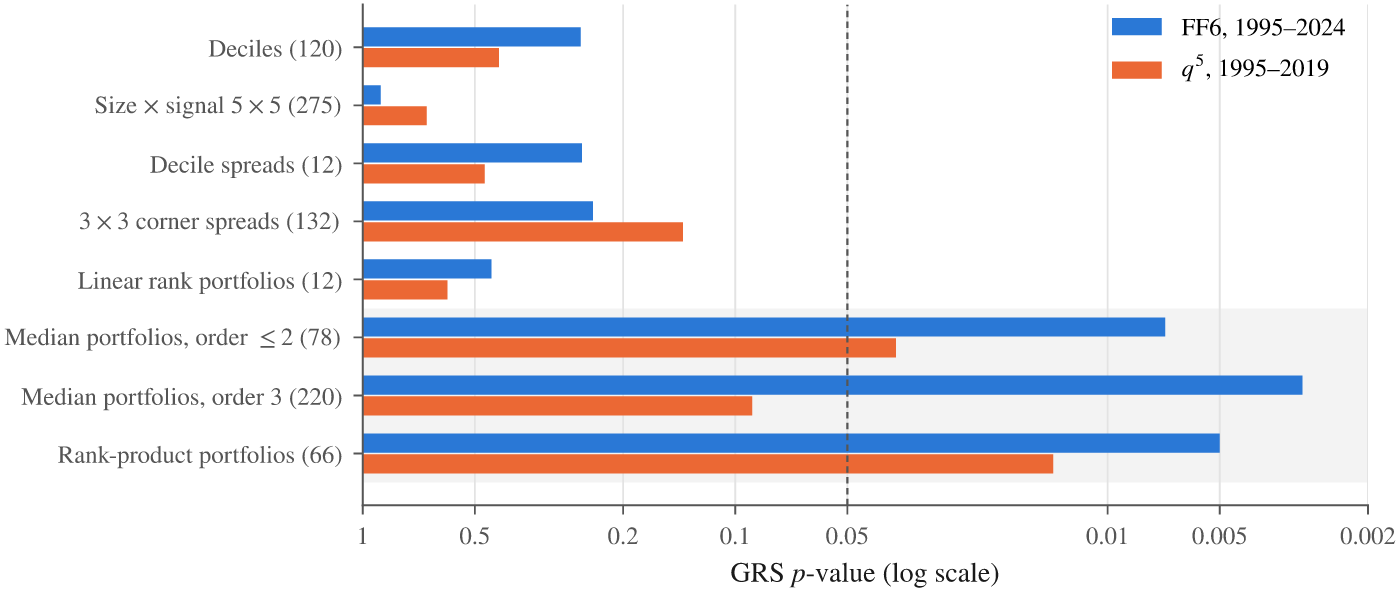
Investors turn signals into holdings through decision rules: buy the top decile, hold stocks with high momentum and low volatility, exclude stocks that fail a screen. Many such rules are Boolean functions of threshold statements about signal ranks, and writing them this way shows both what a rule holds and how often it trades. A Walsh decomposition splits the return of any rule into exposures to individual signals and to interactions among signals; an intersection and a union of the same two screens, for example, have opposite interaction exposures. The same coefficients, together with the persistence of the underlying statements, determine turnover. Interactions are less persistent than their components, so rules that load on higher-order interactions trade more, and thresholds discard information, so at equal risk threshold implementations of interactions trade more than smooth ones. In U.S. stocks from 1973 to 2024, these predictions hold closely: predicted and realized persistence have correlations of at least 0.999, predicted turnover matches realized turnover with a slope of 1.02, and the same interactions are more persistent as products of ranks than as threshold rules. Trading costs rise with order, and because premia fall with order, 58% of single-signal portfolios have absolute premia above their quoted-spread costs over 1995-2024, against 24% of two-signal and 6% of three-signal interaction portfolios. Out of sample, interaction portfolios raise the Sharpe ratio of single-signal tangency portfolios, and over 1995-2024 they reject a six-factor model that conventional sorts on the same signals do not reject.
Citations and venue from Semantic Scholar (ODC-BY), refreshed weekly. Summary: Quant Letter (CC BY 4.0).