How market volatility responds to a preceding price trend: a lag-resolved measurement in cryptocurrencies and equities
Measuring minute-by-minute volatility response to preceding trends, the research finds asymmetry and evidence of one-sided temporal response in cryptocurrencies but not equities, decomposed via time-reversal symmetry.
Featured in No. 138 on 6 Nov 2026 · 2 days after release
- Released
- 4 Nov 2026
- First featured
- No. 138 · 6 Nov 2026
- Published in
- Not yet, as far as Semantic Scholar knows
- Fanfare
- 2 of 5
- Identifier
- arXiv:2611.04533
- Authors
- Gulsah Bicki and Taylan Akdogan
Abstract
From arXiv (CC0).
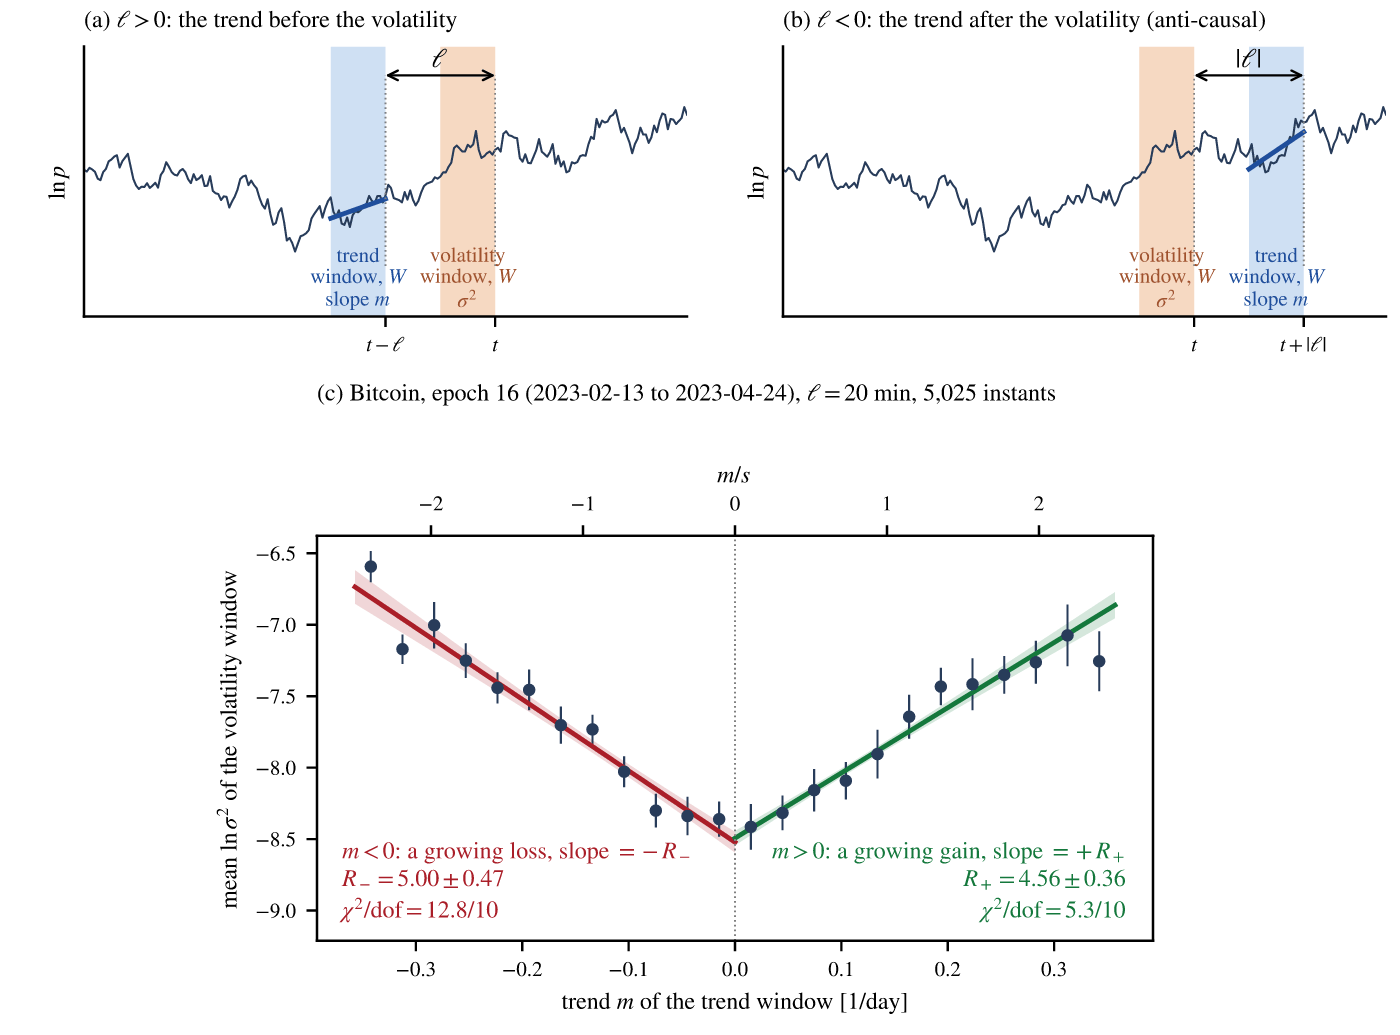
We quantify the response of market volatility to a preceding price trend as a function of lag at minute resolution. The asymmetry of the response is investigated. The sample consists of trades in three of the largest cryptocurrencies on a single exchange and in three large US stocks and the S&P 500 exchange-traded fund between 2020 and 2026. For the cryptocurrencies the asymmetry is positive, matching the sign of the leverage effect. It follows the trend: it is greatest at the first measurable lag, 20 minutes, and weak at negative lags, where the trend follows the volatility. At those lags a scan over window lengths resolves a small component of opposite sign that has not yet been disentangled from what the statistic itself generates. For Bitcoin and Ether the asymmetry decays to one half by a lag of roughly an hour and a half. Decomposition under time reversal divides the asymmetry into a T-even part and a T-odd part. Only the latter carries an arrow of time. For Bitcoin and Ether the T-odd part is detected. At the first lag it is between 0.4 and 0.9 of the T-even part at windows of 10 and 20 minutes. At 20 minutes this is the ratio produced by a purely one-sided response in this statistic: at that window the response is consistent with being wholly one-sided in time. None of the equities exhibits a detectable T-odd part at 20 minutes in the straight-line fit over 2.5 trend scales. This fit is the shared instrument of comparison. The fund's return-variance correlation displays an arrow of time; the cryptocurrencies' asymmetry is independent of the shapes of the fits, and Bitcoin's and Ether's of their ranges. On simulated and shuffled data without coupling, the analysis yields zero with errors of the correct size. It also recovers the time scale of a one-sided response embedded in a simulated market.
Citations and venue from Semantic Scholar (ODC-BY), refreshed weekly. Summary: Quant Letter (CC BY 4.0).