ML-QuantSubscribe

Quant Letter

November 2026, Week 1

The week in quantitative finance research: 90 papers from arXiv, SSRN and RePEc, screened and ranked, 31 Oct – 6 Nov 2026.

Papers
90
New this week
90
With figures
50
High fanfare
9

From the editor

This week spotlights credibility gaps in quantitative finance: LLMs lose predictive power in live trading despite strong backtests, knowledge cutoffs and future-look bias inflate strategy alphas, and reproducibility remains fragile. Standouts: LLM Stock-News Signals Under Scrutiny, LLM Knowledge Cutoffs and Backtests, and Bounded LLM Research Loop for Trading.

Top picks

If you read five papers this week, read these.

  1. LLM Stock-News Signals Under Scrutiny

    A pre-registered blinded test finds that language-model readings of company news lose their predictive power in real time and that commercial models identify masked companies in two-thirds of cases.

    Fanfare 4LLMs & Text
    No pre-registered strategy survives costs: net of 10 basis points every main book loses, and the convergence strategy
  2. The Hidden Sharpe Ratio

    Fanfare 4Portfolio & Allocation

    The study estimates maximum Sharpe ratios in large cross-sections without constructing the efficient portfolio, finding annualized maximal Sharpe of 7.4 in U.S. equities versus benchmark estimates of 1.0 to 4.0.

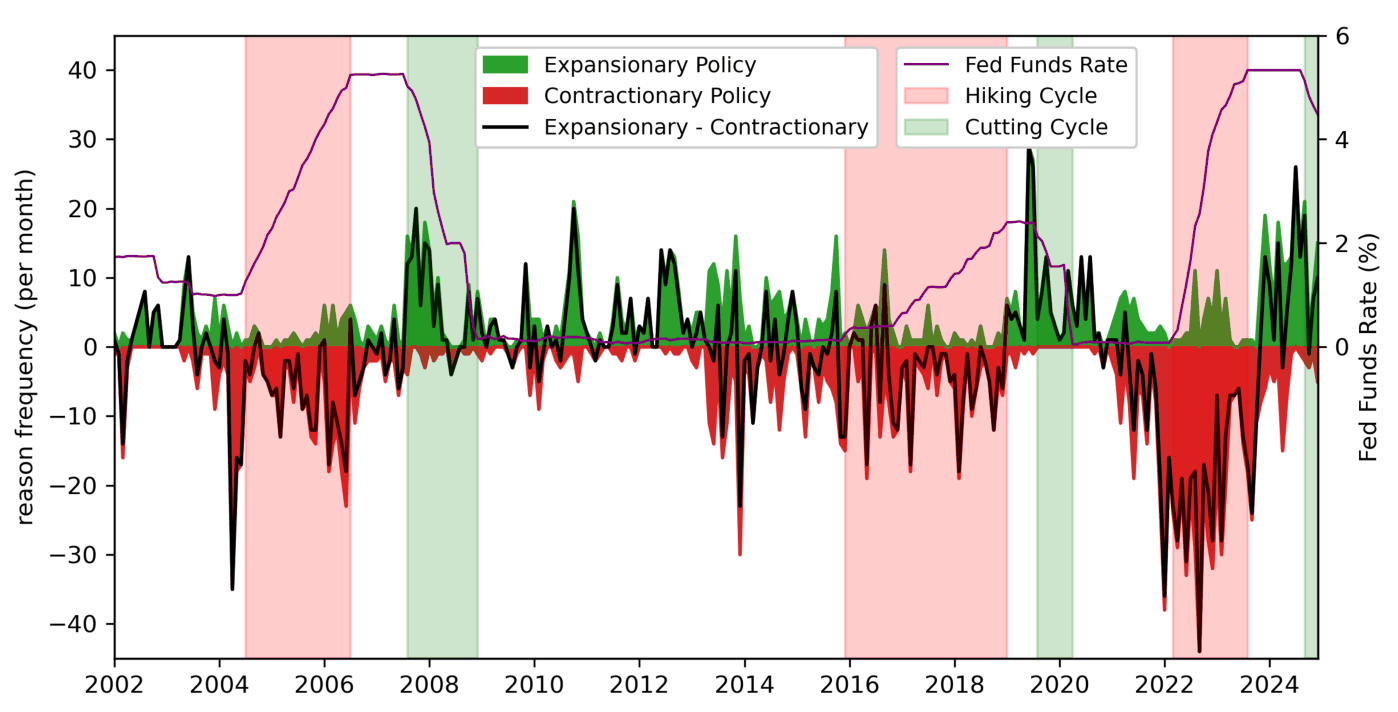
  3. Monetary policy expansionary and contractionary periods overlaid with interest rate movements over time.
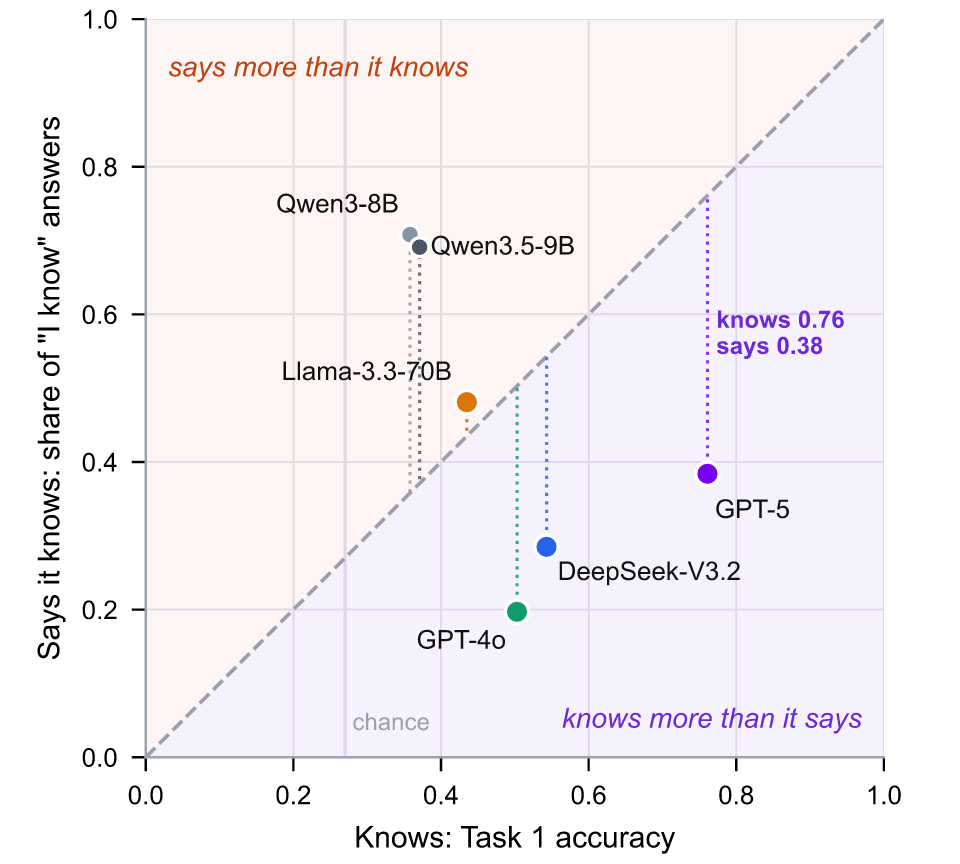
  4. What models know versus what they say
  5. Following AI adoption, financial analysts revise high-ESG forecasts upward and become more bullish, but forecast accuracy deteriorates and errors rise for top-ESG firms.

What's rising

Topics drawing unusually many papers this week.

  1. Yield curve

    2.6×

    2.0% of this week's 441 new papers, 2.6x its share over the previous 6 weeks (0.8%).

  2. Regime switching

    1.8×

    2.0% of this week's 441 new papers, 1.8x its share over the previous 6 weeks (1.1%).

  3. Earnings and analysts

    1.4×

    4.8% of this week's 441 new papers, 1.4x its share over the previous 6 weeks (3.3%).

GitHub radar

What the quant community starred on GitHub this week, from a panel of 10,589 developers who follow financial machine learning (290 of the 858 we checked starred something). Counts only: we never publish who starred what.

Quant repos rising

  1. Claude skills for day trading with backtesting and timing.

    ★ 5,704+2,004 this weekPythonNew repo

  2. Real-time event intelligence and fraud detection for finance.

    ★ 231+233 this weekTypeScriptNew repo

  3. QuantJourney backtester for testing trading strategies.

    ★ 597+426 this weekPython

  4. QuantLib models with hidden Markov regime switching.

    ★ 11+3 this weekPythonNew repo

  5. Local-first investment research system with 18 investor personas.

    ★ 681+32 this weekPython

  6. Finance terminal for Bloomberg-style market data tracking.

    ★ 2,654+70 this weekTypeScript

  7. Foundation model for the language of financial markets.

    ★ 47.0k+2,827 this weekPython

  8. Multi-agent LLM framework for financial trading.

    ★ 121k+2,276 this weekPython

What quants are playing with

  1. Framework for building semantic graph-based reasoning layers over data.

    ★ 8,496+7,839 this weekPython

  2. CLI for AI agents to use computers.

    ★ 17.8k+15.2k this weekRust

  3. Towards a more autonomous agent system.

    ★ 20.1k+20.1k this weekTypeScriptNew repo

  4. Understand how any software works and craft your own.

    ★ 17.0k+17.0k this weekRustNew repo

  5. Open-source bot with virtual machine for agent use.

    ★ 14.6k+5,650 this weekTypeScriptNew repo

  6. AWS local emulator alternative.

    ★ 30.7k+3,363 this weekJava

  1. Now publishedConvergence of Heavy‐Tailed Hawkes Processes and the Microstructure of Rough Volatility

    Now published in Mathematical Finance · featured 20 Dec 2023, 6 days after release; 18 citations

  2. 25 citationsCourse-Skill Atlas: A national longitudinal dataset of skills taught in U.S. higher education curricula

    Passed 25 citations · featured 24 Apr 2024, 5 days after release

  3. 10,000 citationsMamba: Linear-Time Sequence Modeling with Selective State Spaces

    Passed 10,000 citations · featured 5 Jun 2024

All papers

Filter by venue, topic or fanfare.

Venue
Topic
Fanfare
90 papers

arXiv

Quantitative finance and ML-for-finance preprints

30 papers · 26 figures

LLMs & Text3

01

LLM Stock-News Signals Under Scrutiny

A pre-registered blinded test finds that language-model readings of company news lose their predictive power in real time and that commercial models identify masked companies in two-thirds of cases.

Fanfare 4LLMs & TextAmir Dehkordi et al.PDF
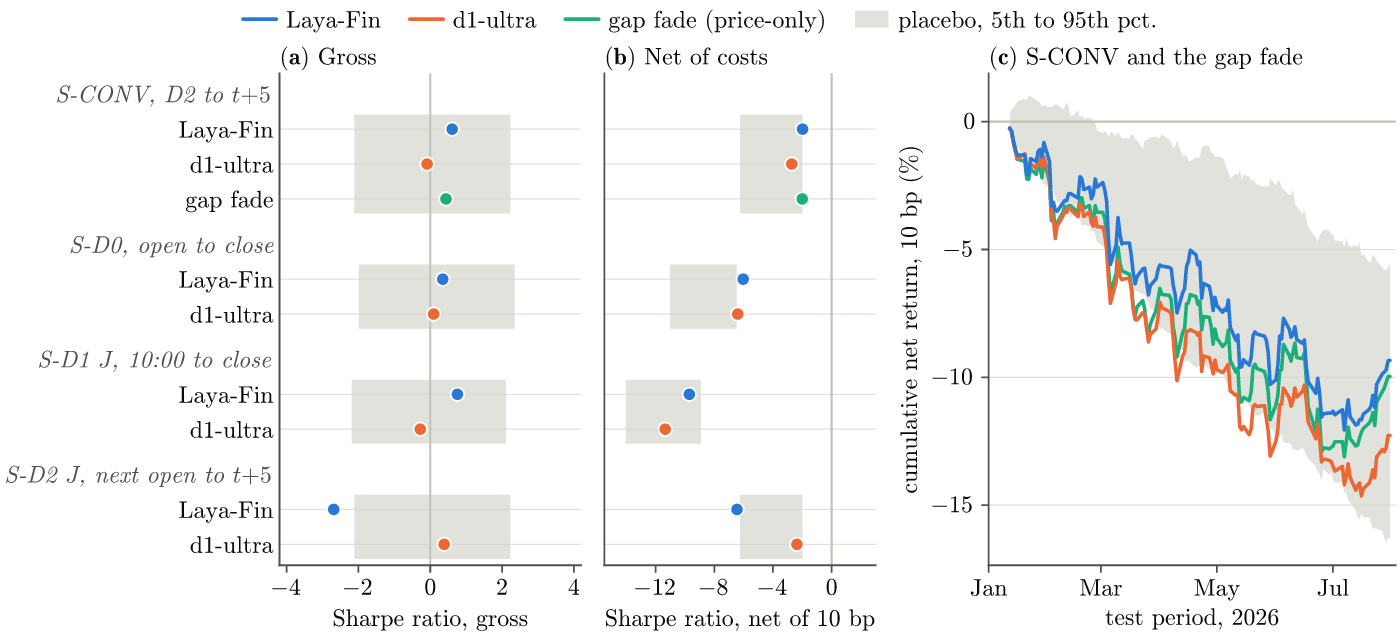
No pre-registered strategy survives costs: net of 10 basis points every main book loses, and the convergence strategy
Figure 8: No pre-registered strategy survives costs: net of 10 basis points every main book loses, and the convergence strategy is effectively a price-only gap fade (92%…
02

LLM Knowledge Cutoffs and Backtests

A benchmark of 2,226 dated facts reveals that frontier language models underreport their knowledge and answer most facts they claim not to know, compromising backtest validity.

Fanfare 4LLMs & TextLingfei Qian et al.PDF

What models know versus what they say
Figure 2 : What models know versus what they say. The x-axis is Task 1 accuracy on controlled facts (chance \approx 0.27) and the y-axis is the share of Task 2 Recall an…
29

Multidimensional Analyst Views from LLM Text

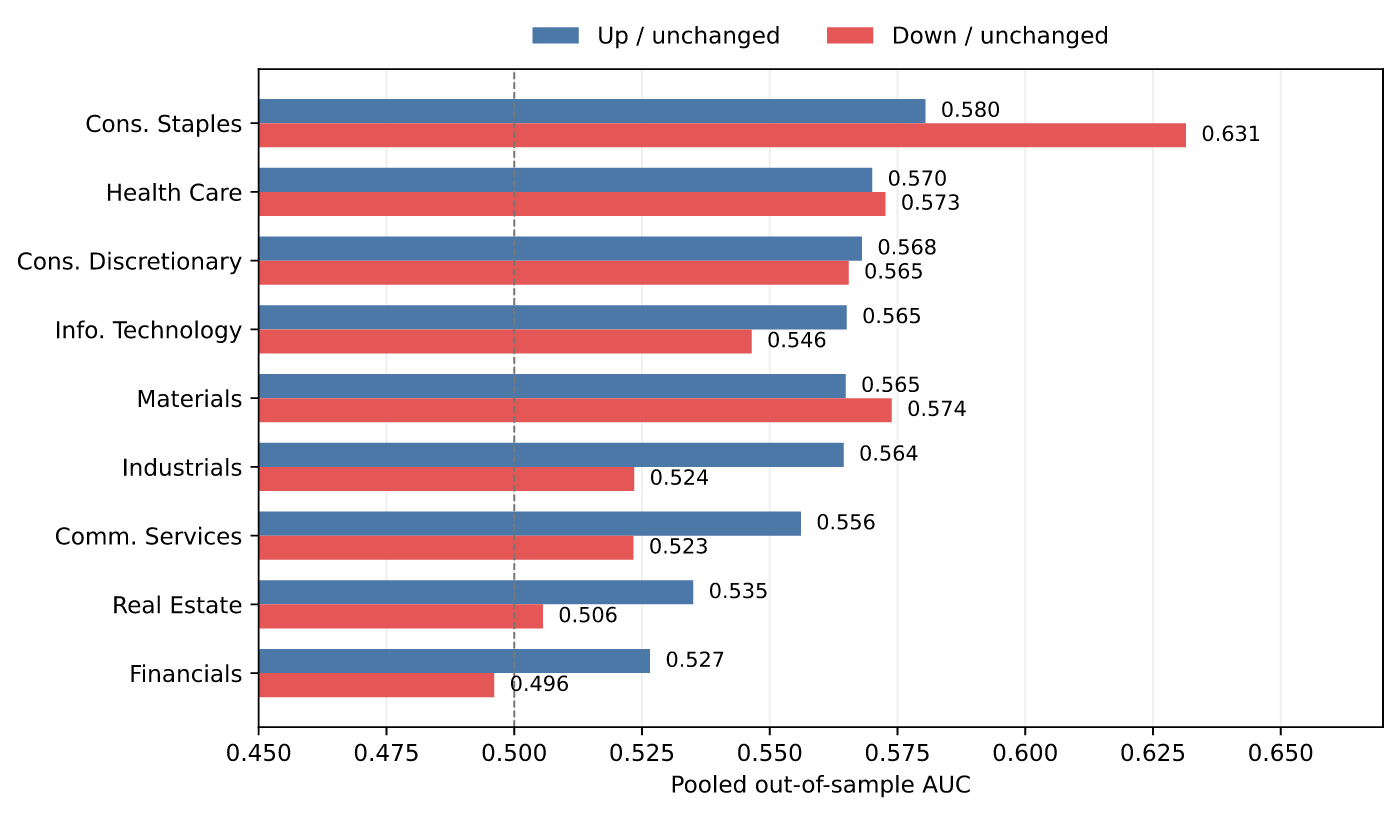
Question-based outlook scores extracted from analyst reports by an LLM improve prediction of target-price revisions beyond traditional sentiment measures.

Fanfare 2LLMs & TextKiyoun Kim and Sung-Yeon Nathan LimPDF

Prediction performance of separately trained GICS-sector models using current revision and QOS. Bars show pooled
Figure 4. Prediction performance of separately trained GICS-sector models using current revision and QOS. Bars show pooled out-of-sample AUCs over available quarterly te…

Asset Pricing & Factors4

03

Cryptocurrency Trend Factor Audit

A code audit of the cryptocurrency trend factor reveals that after correcting for future-information use and technical-indicator issues, the factor's alpha becomes statistically insignificant and cannot replace momentum.

Fanfare 3Asset Pricing & FactorsYifei Wang and Zhenling PangPDF

Performance revisions and benchmark dependence
Figure 1 : Performance revisions and benchmark dependence
05

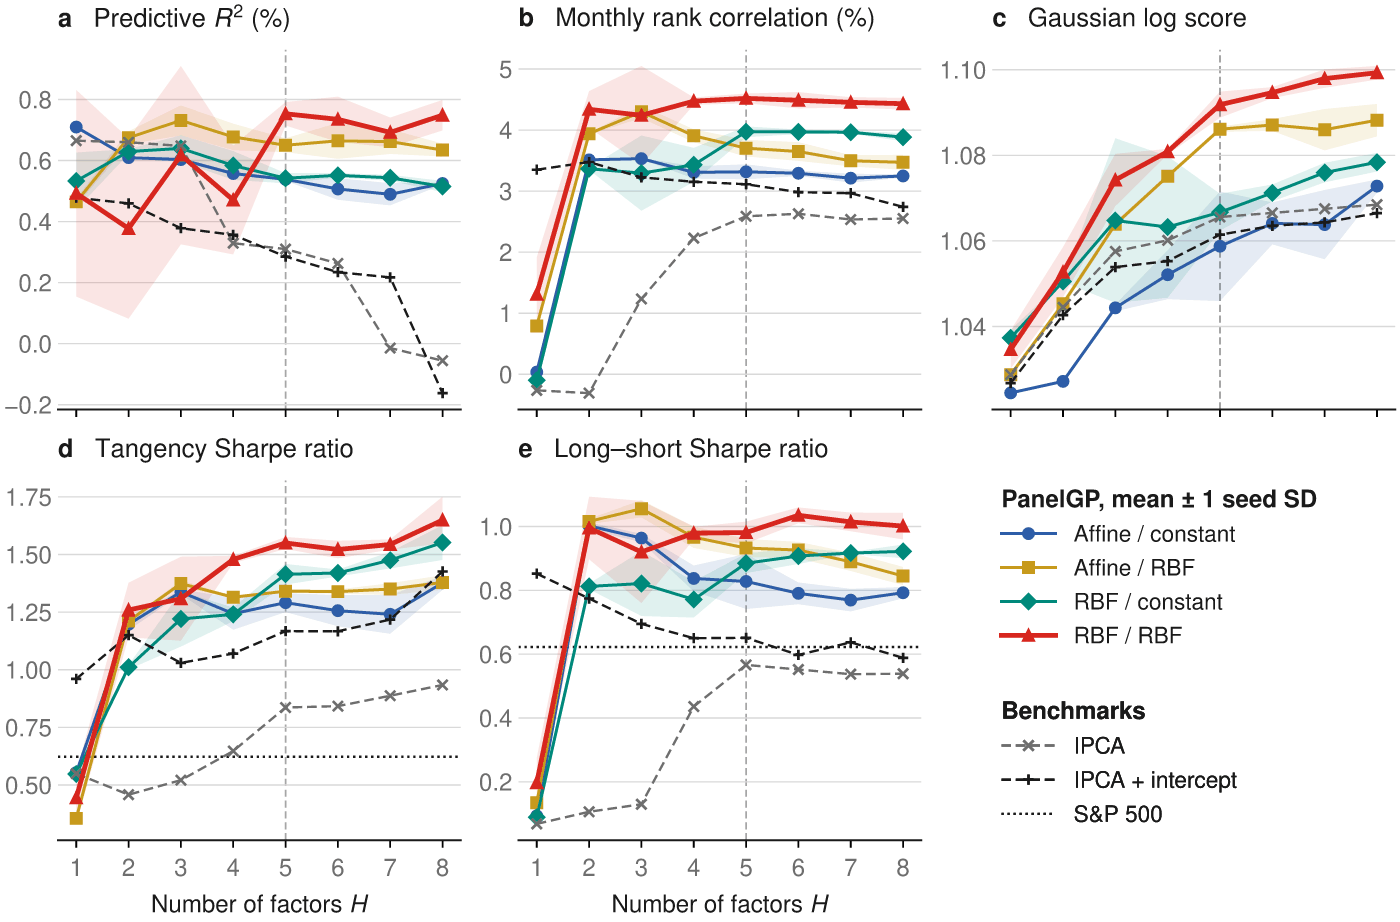
PanelGP Nonlinear Factor Model

A Gaussian-process factor model with nonlinear loadings estimated from firm characteristics improves stock ranking and portfolio Sharpe ratios over linear alternatives on S&P 500 data.

Fanfare 3Asset Pricing & FactorsAndrea Ruglioni and Damir FilipovicPDF

Results by number of factors H over the evaluation period
Figure 3: Results by number of factors H over the evaluation period. PanelGP curves show five-seed means, and bands extend one sample standard deviation across seeds on…
21

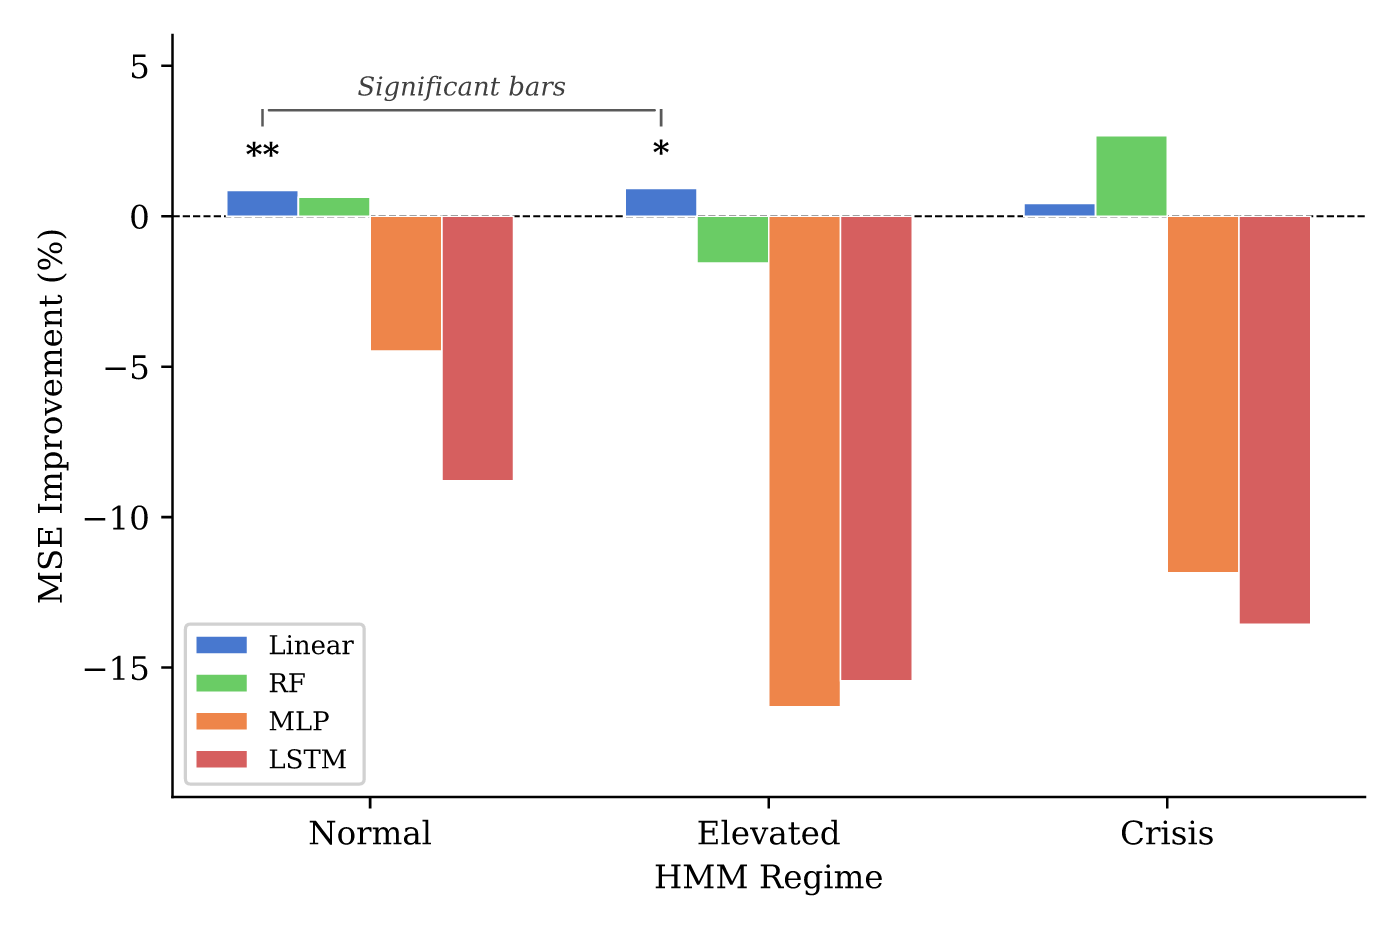
Predicting Factor Decay with ML

Machine learning models predict when cross-factor predictability will erode, achieving high C-index on held-out pairs and finding that stronger signals decay faster.

Fanfare 2Asset Pricing & FactorsChorok LeePDF

Four-model diagnostic: MSE improvement (%) from including HML lags, by regime and model class
Figure 4. Four-model diagnostic: MSE improvement (%) from including HML lags, by regime and model class. Only linear models achieve significant improvement; nonlinear me…
28

Specification LASSO for Asset Pricing

A two-step LASSO-based method selects variables and model specification jointly in high dimensions, with oracle properties; applied to characteristics-based pricing, it reveals linear and nonlinear effects and interactions with firm size.

Fanfare 2Asset Pricing & FactorsChaohua Dong et al.PDF

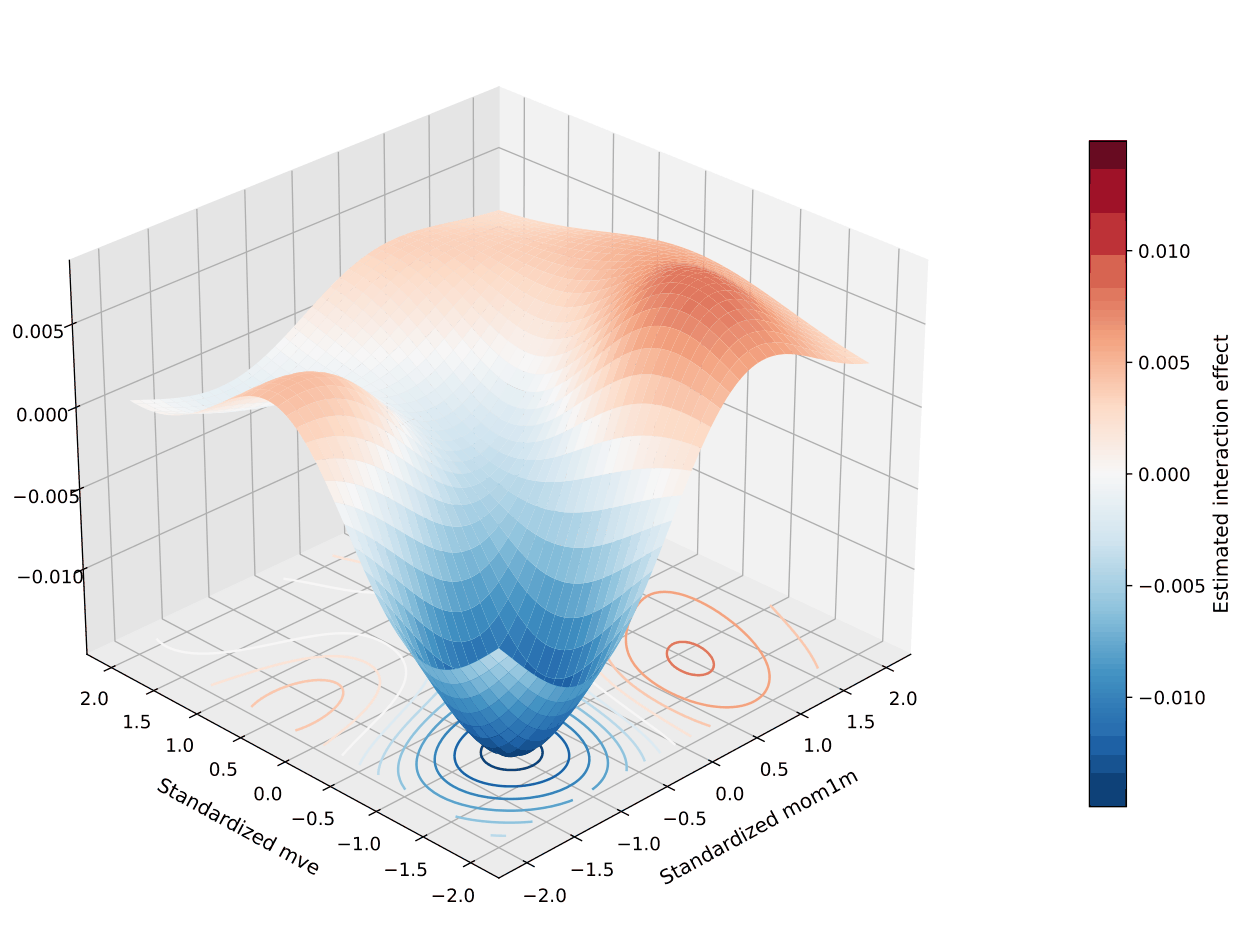
Estimated interaction surface between one-month momentum ‘mom1m’ and firm size ‘mve’. Both axes are standardized
Figure 4 : Estimated interaction surface between one-month momentum ‘mom1m’ and firm size ‘mve’. Both axes are standardized.

Trading, Microstructure & Execution7

04

Bounded LLM Research Loop for Trading

An open-source research loop constrains language-model proposals to strict JSON and enforces immutable data splits, discovery gates, and hash-chained logs to prevent false discoveries in backtest-driven strategy development.

Fanfare 3Trading, Microstructure & ExecutionHenry ZhangPDF

06

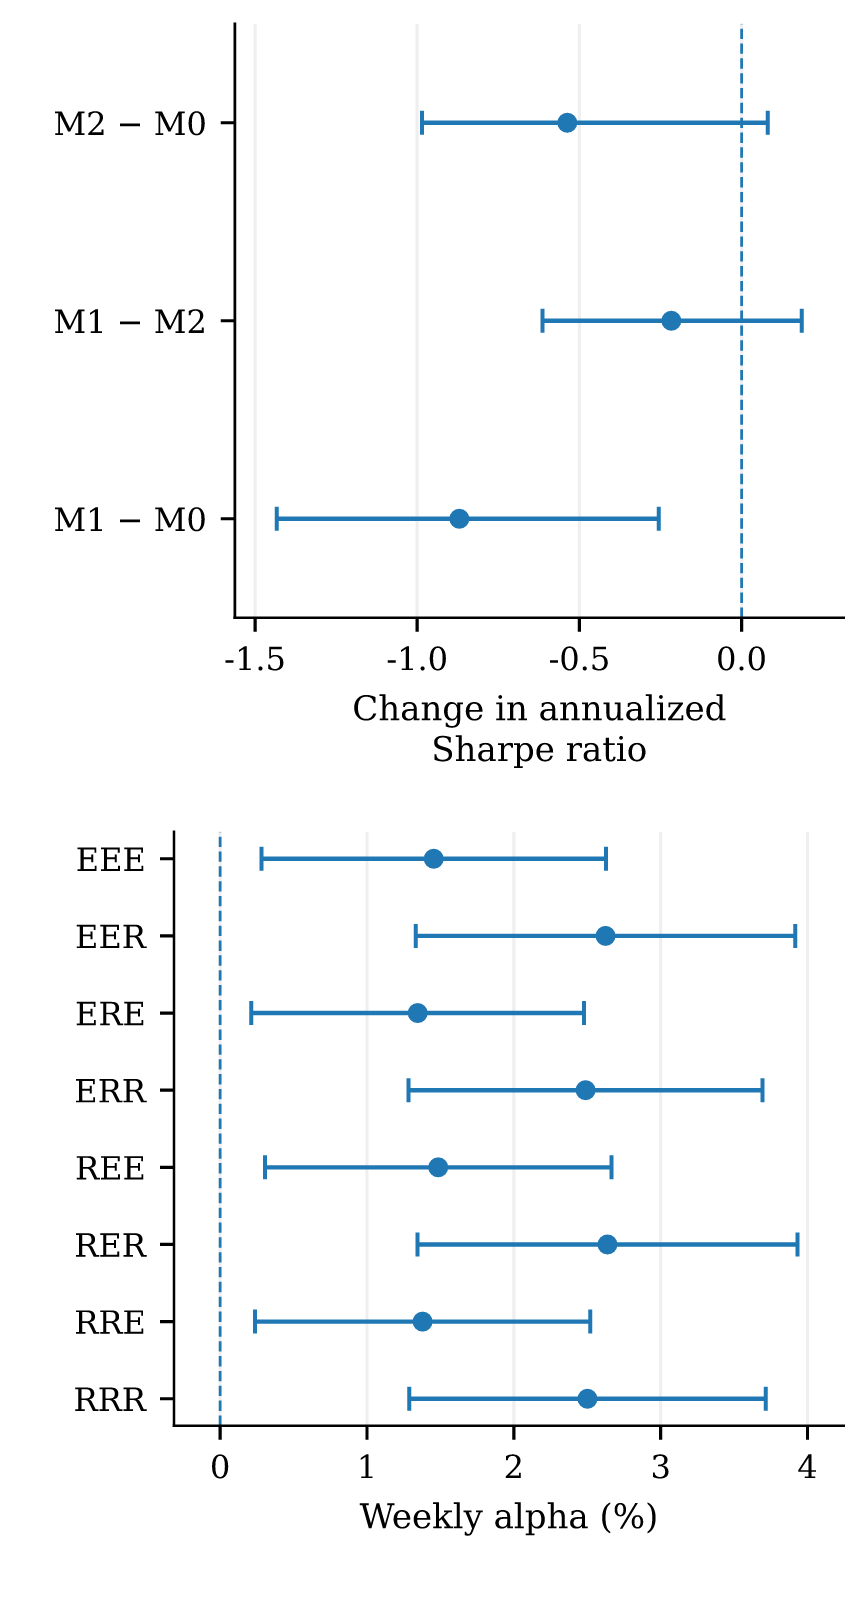
Anytime-Valid Backtest Rules for Agents

A protocol using e-processes and Ville arguments lets researchers monitor candidates born at data-dependent times and adaptively chosen, bounding false promotion rates without a fixed sample size.

Fanfare 3Trading, Microstructure & ExecutionEric Benhamou et al.PDF

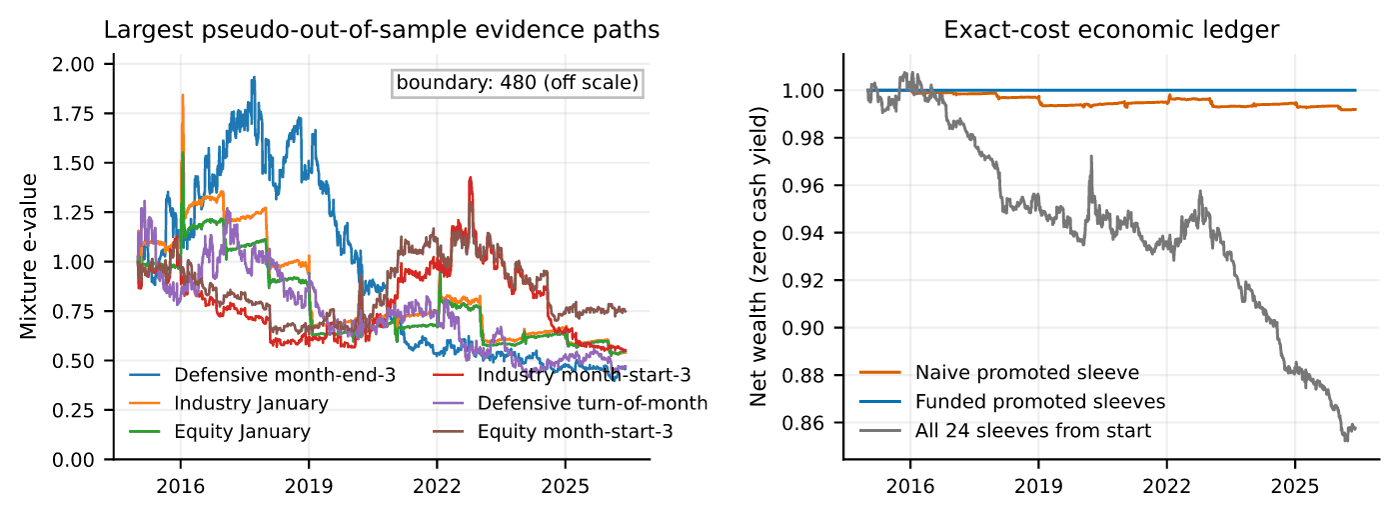
E-process paths over time and portfolio wealth comparison from 2015–2026
Figure 3. Pseudo-out-of-sample evidence and economic ledgers, January 2015–May 2026. Left: the six largest mixture e-processes; the artifact retains all 24 paths. Right:…
07

AI Agents, Market Makers, and Automated Stress

The paper models learning traders on automated market makers, showing herds and arbitrage-dominated markets have identical statistics yet stress episodes differing unboundedly in length, and that maker-taker pricing restores stability.

Fanfare 3Trading, Microstructure & ExecutionIrene AldridgePDF

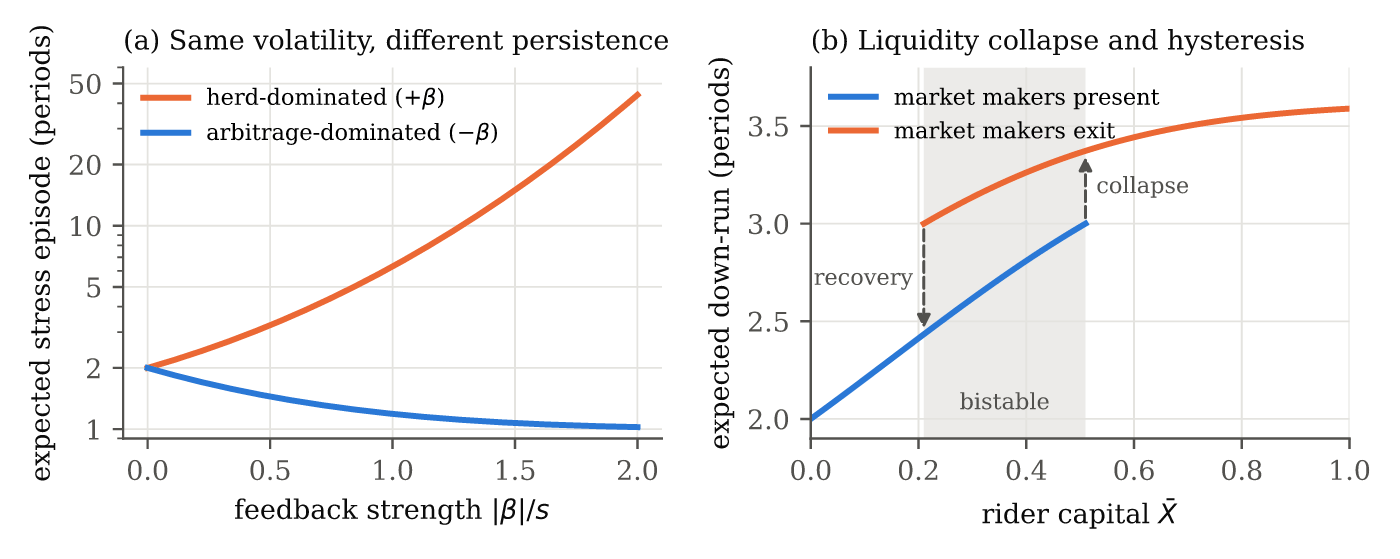
(a) Theorem 4.2 : expected stress-episode length ( c=0 , Gaussian news) in a herd-dominated and an arbitrage-dominated
Figure 1: (a) Theorem 4.2 : expected stress-episode length ( c=0 , Gaussian news) in a herd-dominated and an arbitrage-dominated market. The two have identical volatilit…
09

Order-Flow Herding vs Racing On-Chain

Decomposing cross-account order-flow persistence on decentralized exchanges, the study isolates two components and finds that on-chain herding mostly reflects arbitrageurs racing to centralized prices, not independent traders.

Fanfare 3Trading, Microstructure & ExecutionYichong Bai and Dingyue KanPDF

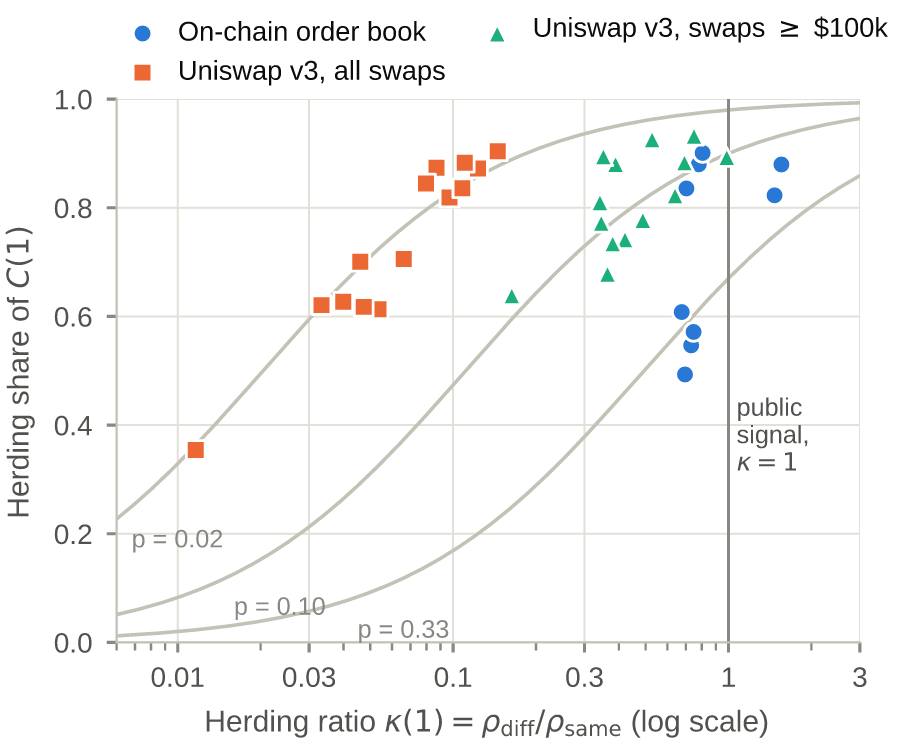
Daily herding share against the herding ratio \kappa (lag one)
Figure 1. Daily herding share against the herding ratio \kappa (lag one). Grey curves show Eq. ( 1 ) for three values of p . The herding share confounds \kappa with p .…
11

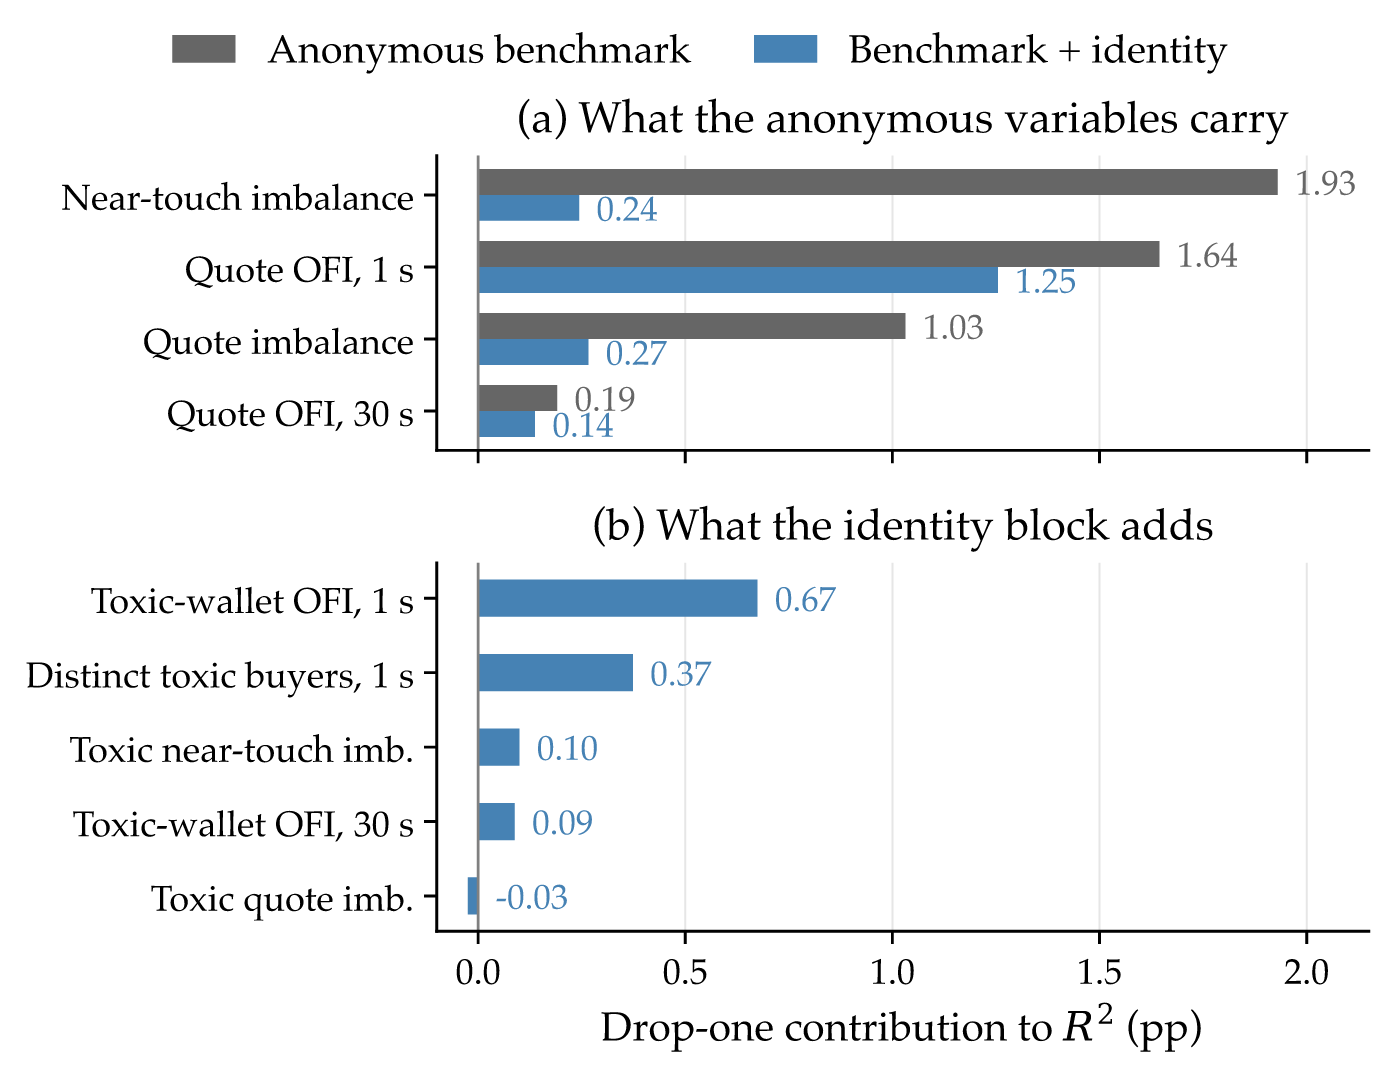
Wallet Identity for Return Prediction

Using pseudonymous wallet addresses from on-chain order books as features, the study finds persistent top-trader markouts reaching 3.11 basis points at ten seconds and improving one-second prediction.

Fanfare 3Trading, Microstructure & ExecutionJingqiu Ding and Daojing ZhaiPDF

Drop-one contributions at the one-second ridge benchmark
Figure 4. Drop-one contributions at the one-second ridge benchmark. (a) Anonymous predictors before and after adding identity; (b) identity predictors. Contributions are…
15

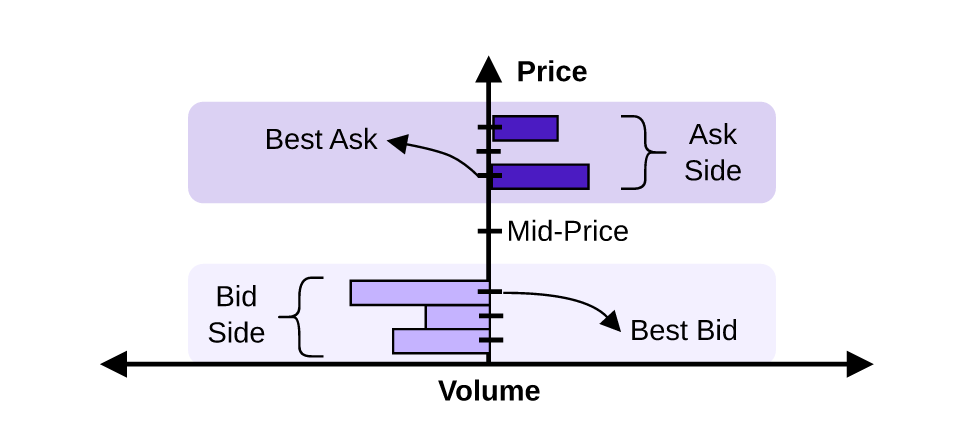
Tensor Learning for Limit Order Books

A tensor-native model for limit-order-book forecasting preserves the multi-way structure of market side, price level, and order attributes, outperforming flattened matrix approaches on benchmarks.

Fanfare 3Trading, Microstructure & ExecutionYuxuan Gu and Danilo MandicPDF

A snapshot of a limit order book snapshot at a single event
Figure 1: A snapshot of a limit order book snapshot at a single event.
22

Market-Making Regret with Persistent Orders

A deterministic market-making policy achieves logarithmic regret against fixed quotes and square-root regret against dynamic quotes when orders persist until execution.

Fanfare 2Trading, Microstructure & ExecutionNicolò Cesa-Bianchi et al.PDF
ML & AI Methods2

08

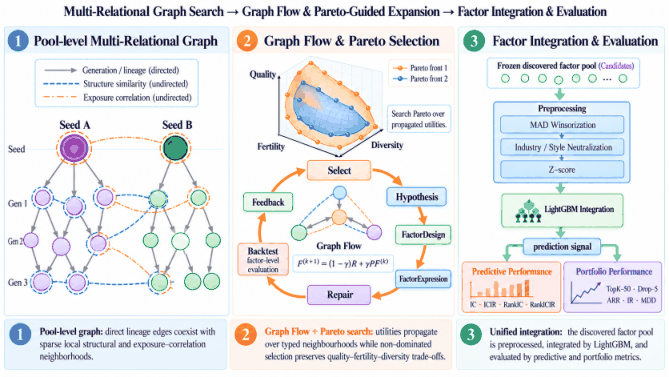
CosmosAlpha: Graph-Based Alpha Factor Mining

A graph-structured framework discovers alpha factors using an LLM, connecting factors by generation, similarity, and correlation while applying Pareto-guided search to balance quality, fertility and diversity.

Fanfare 3ML & AI MethodsZhan-He Wang et al.PDF
Overview of CosmosAlpha
Figure 1: Overview of CosmosAlpha. (1) Evaluated factors form a pool-level multi-relational graph with generation, structure, and exposure-correlation edges. (2) Graph F…
13

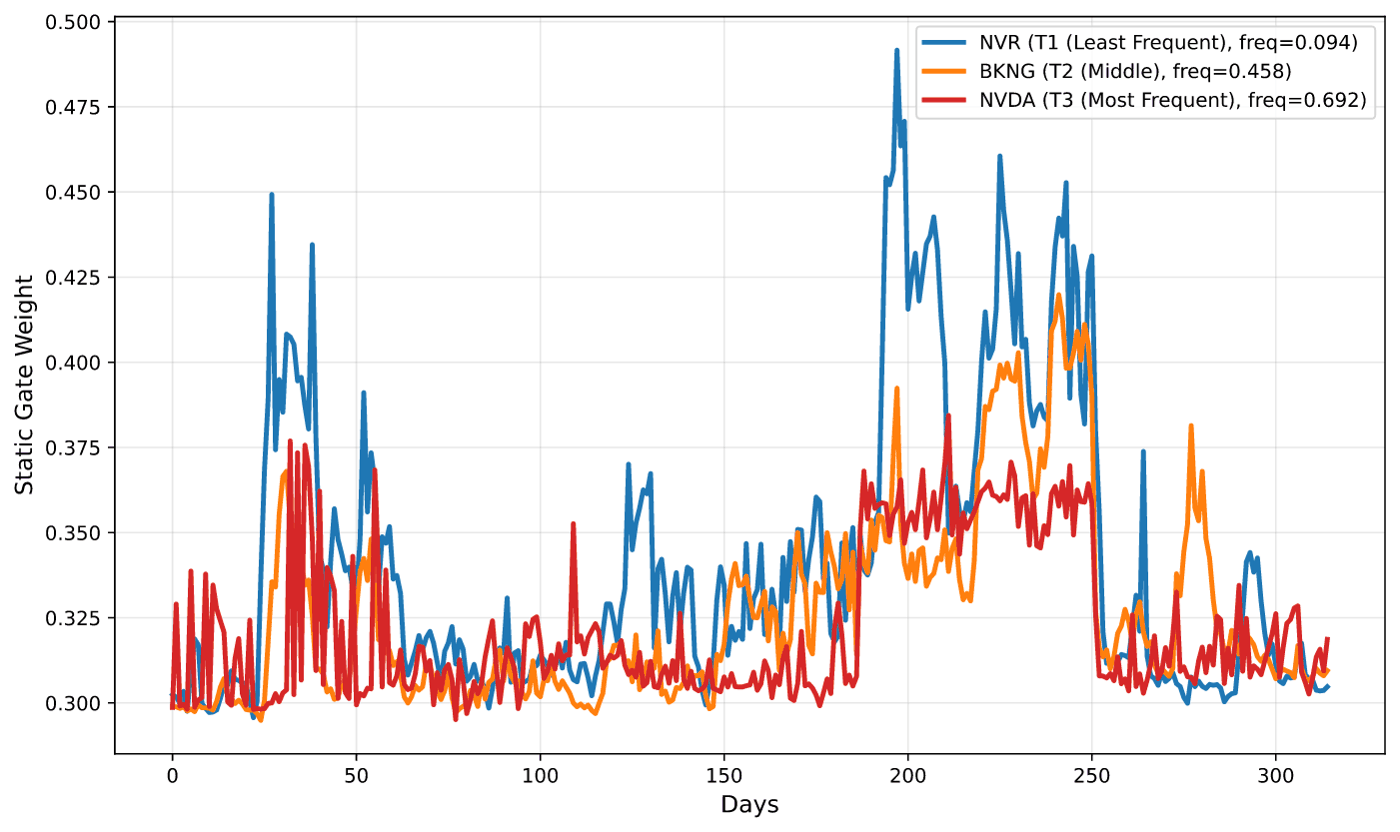
LLM Priors and News Graphs for Stock Ranking

A graph framework that weights extracted relations by reliability improves stock ranking on the S&P 500 by 16.4% in average recall and 22.6% in success rate.

Fanfare 3ML & AI MethodsHao Zhou et al.PDF
Static gate weights for representative stocks from different news coverage groups: NVR (low coverage, freq=0.094), BKNG
Figure 3. Static gate weights for representative stocks from different news coverage groups: NVR (low coverage, freq=0.094), BKNG (medium coverage, freq=0.458), and NVDA…

Derivatives & Volatility7

14

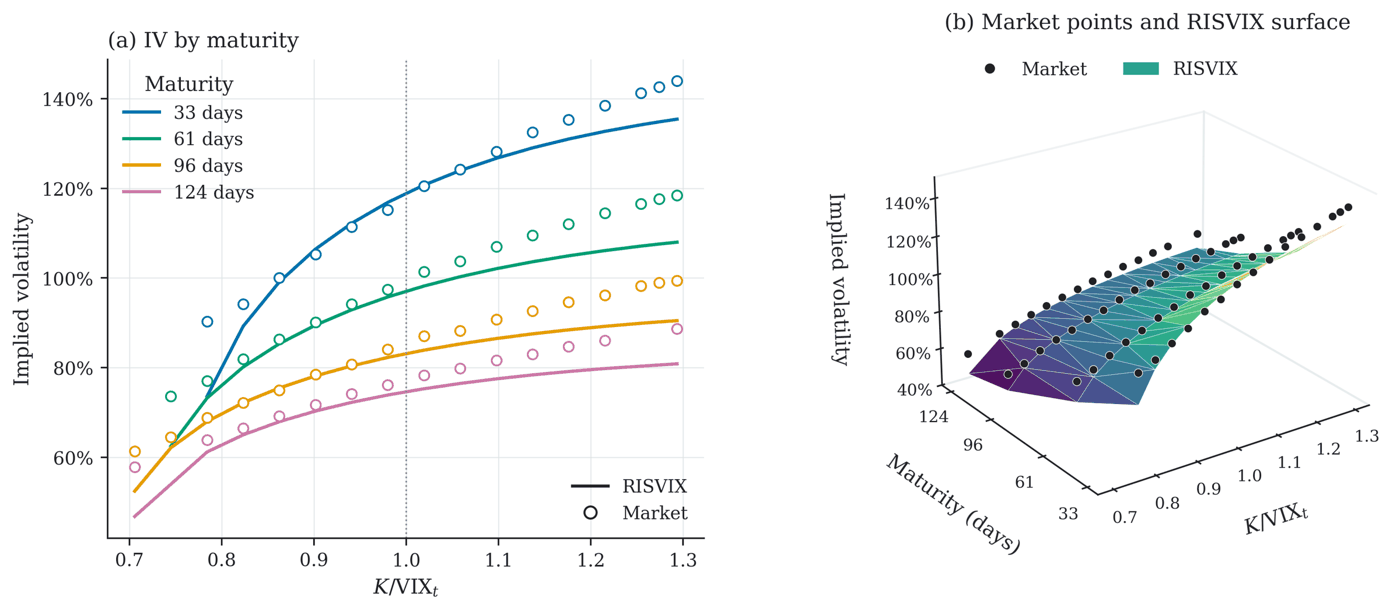
Rough Instantaneous Squared VIX Model

A rough-memory VIX model with Mittag-Leffler decay improves term-structure fit and out-of-sample option pricing, with larger gains during elevated volatility and shorter maturities.

Fanfare 3Derivatives & VolatilityTianfeng Yang et al.PDF
VIX option implied-volatility surface
Figure 6: VIX option implied-volatility surface. Panel (a) compares market and RISVIX implied volatilities across moneyness for four maturities on March 17, 2023. Panel…
18

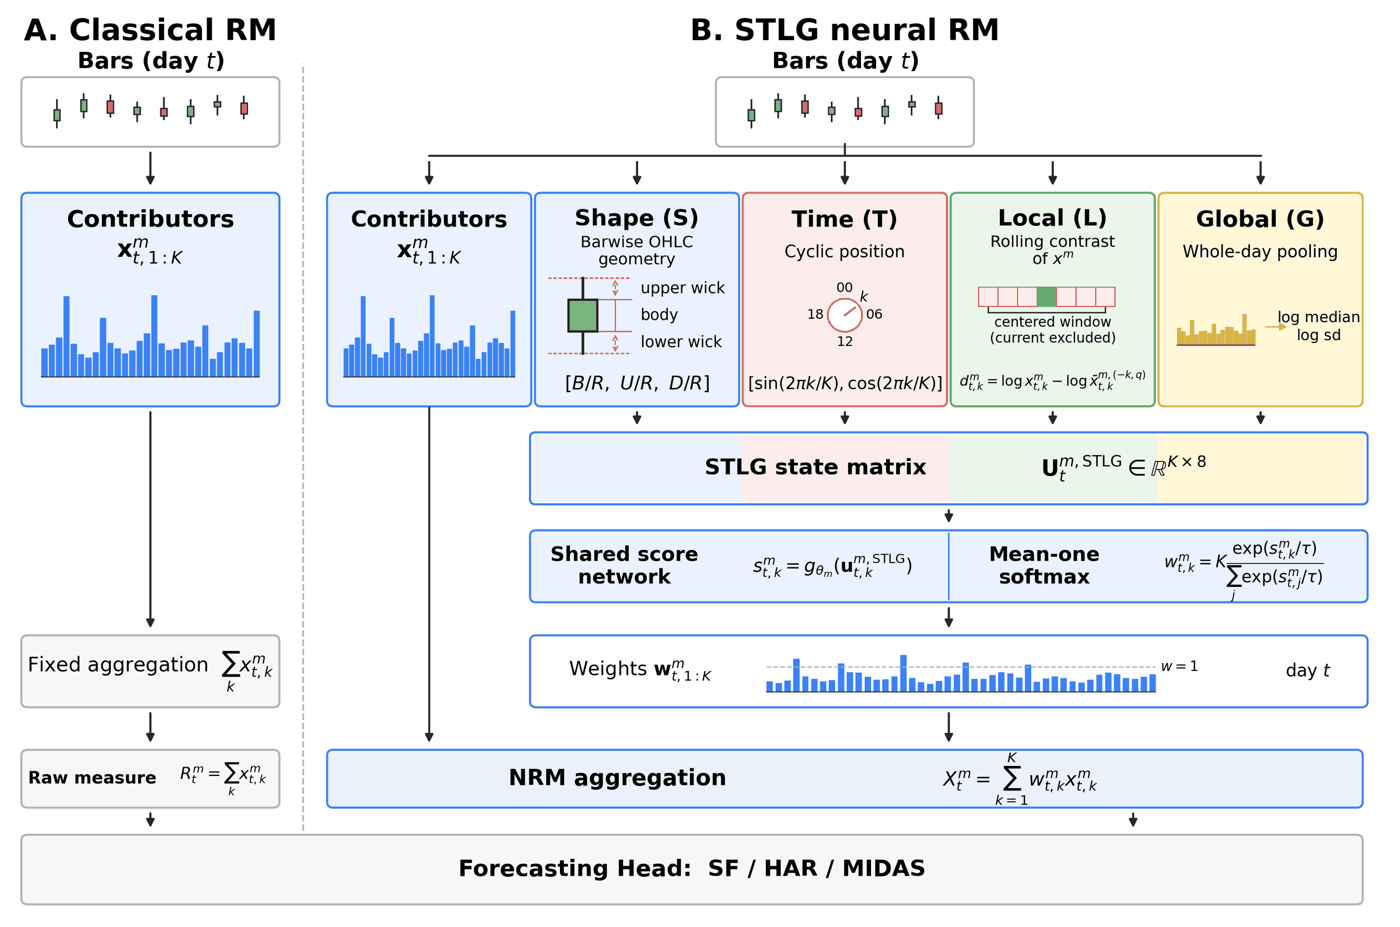
Neural Realized Measures for Volatility

Learning forecast-supervised weights for intraday volatility aggregation reduces forecasting error while preserving the structure of classical realized measures like raw realized variance.

Fanfare 2Derivatives & VolatilityBrian Sing Fan Chan and Jennifer So Kuen ChanPDF

Classical realized-measure and NRM pipelines
Figure 1. Classical realized-measure and NRM pipelines. The classical construction sums fixed primitive contributions. NRM retains the same primitive sequence but forms…
19

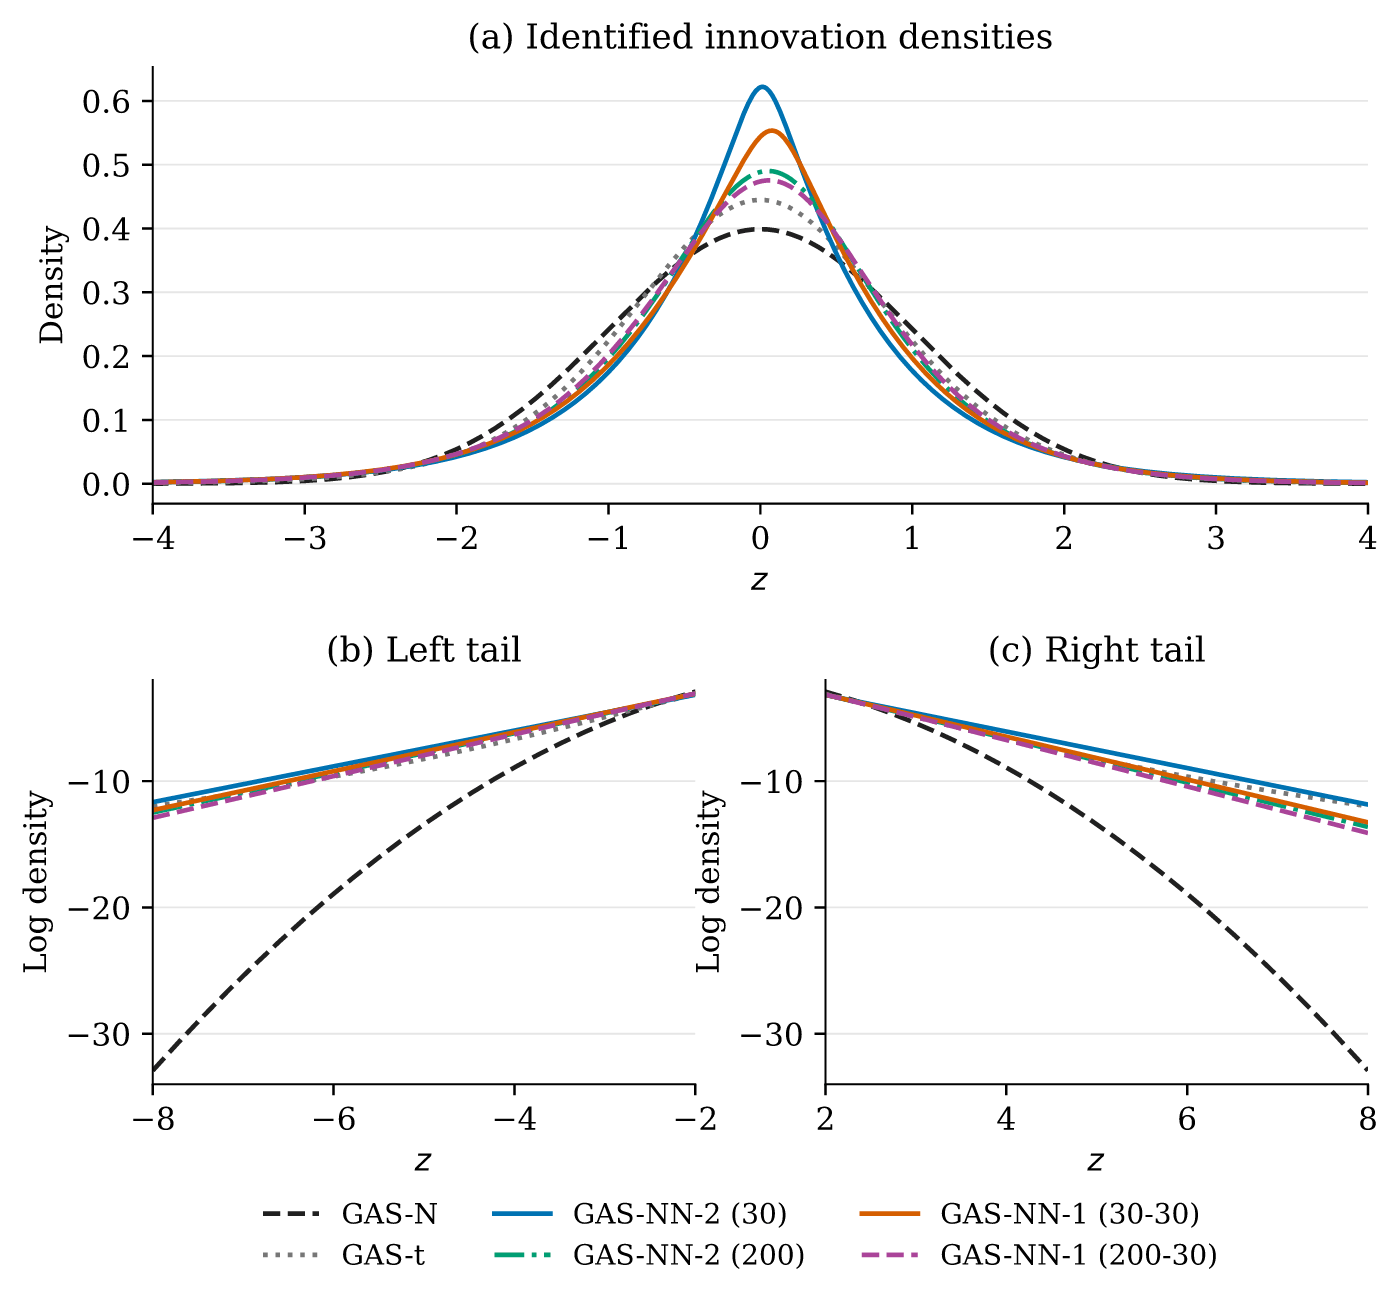
Neural Score-Driven Volatility Models

A score-driven volatility model using neural networks to represent innovation density flexibly outperforms Gaussian and Student-t benchmarks, especially during high-volatility periods like COVID-19.

Fanfare 2Derivatives & VolatilityQianli Zhao et al.PDF
Neural network innovation densities compared to Gaussian and Student-t benchmarks across tails.
Figure 2: FTSE identified innovation densities
20

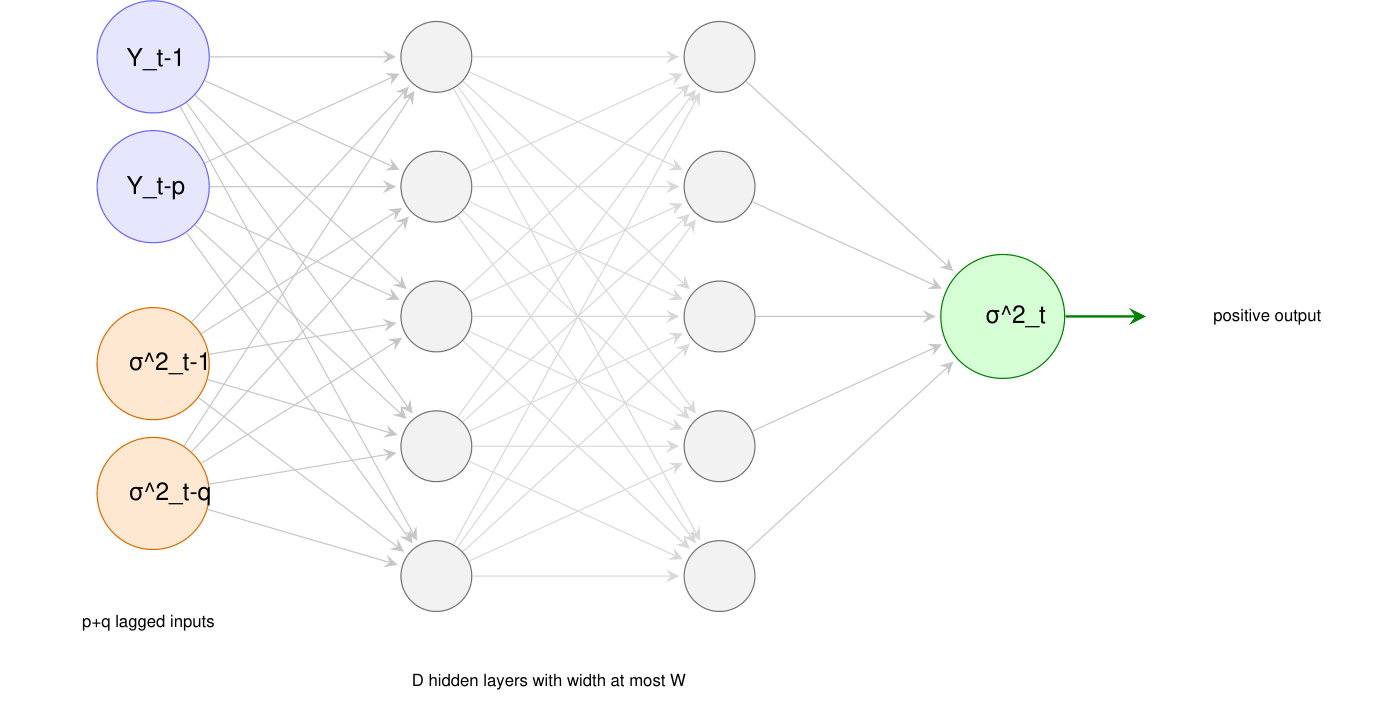
Nonparametric GARCH Neural Estimator

An iterated neural estimator for GARCH processes alternates between learning the recursion and updating conditional variances, achieving minimax-optimal rates for in-sample and forecasting tasks.

Fanfare 2Derivatives & VolatilityRuizhi Deng et al.PDF
Neural network architecture diagram showing inputs, hidden layers, and conditional variance output.
Figure 1: The neural network used at each iteration. The inputs are the p return lags and the q variance estimates from the preceding iteration. The \mathcal{D} hidden l…
25

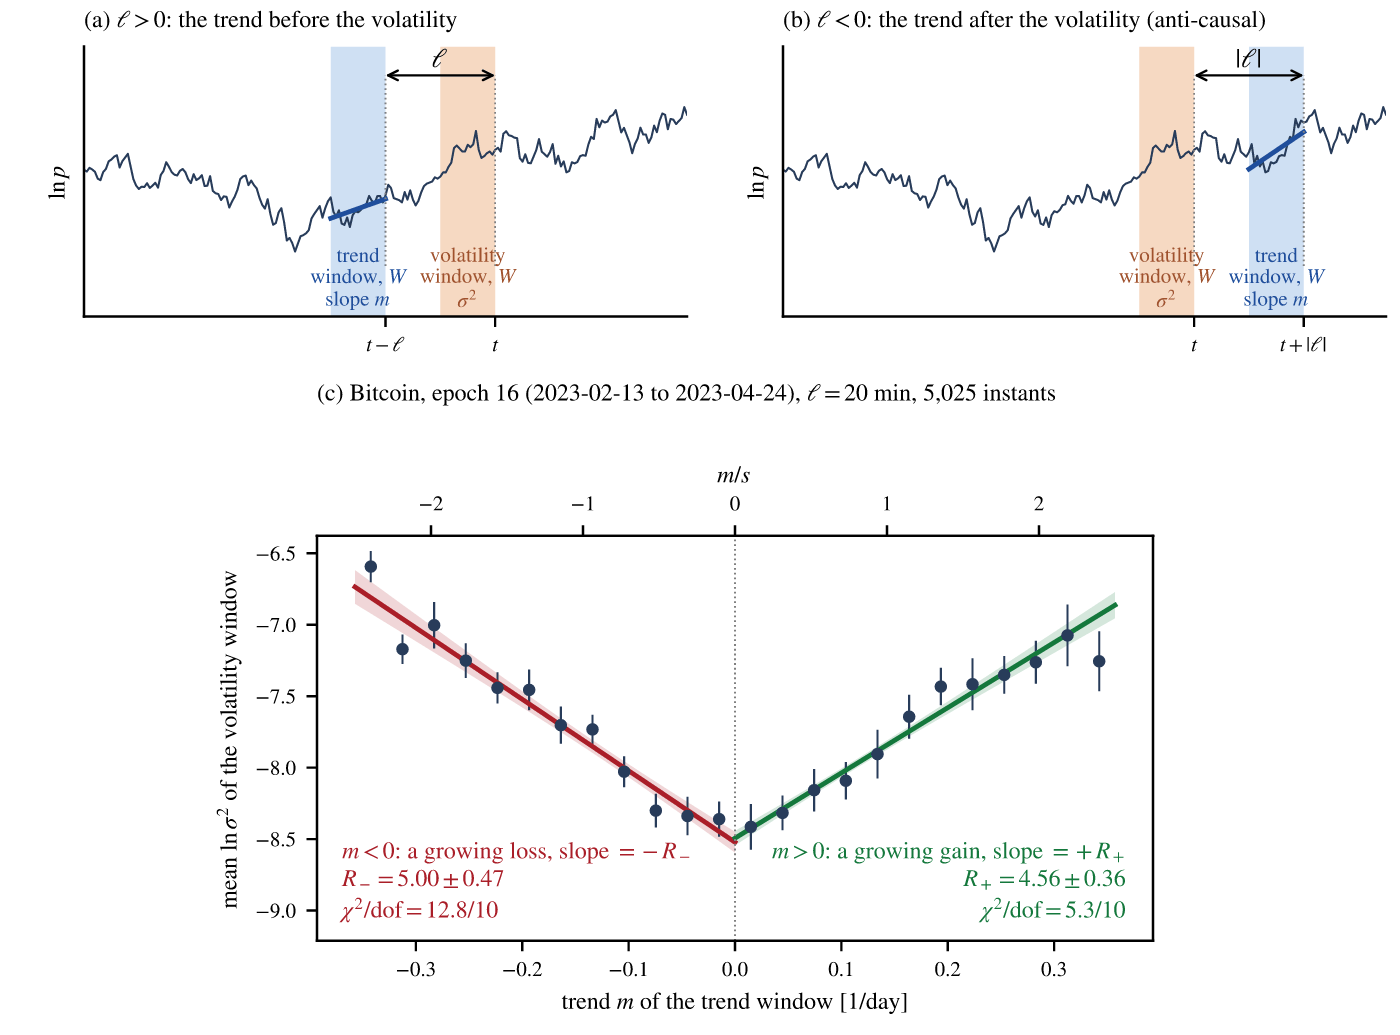
Volatility Response to Price Trends at Minute Lag

Measuring minute-by-minute volatility response to preceding trends, the research finds asymmetry and evidence of one-sided temporal response in cryptocurrencies but not equities, decomposed via time-reversal symmetry.

Fanfare 2Derivatives & VolatilityGulsah Bicki and Taylan AkdoganPDF

The measurement
Figure 1: The measurement. Top: a log-price trajectory with a trend window of length W=20 min and a volatility window of the same length, displayed for a positive lag \e…
27

Fast Regime Switching in Derivatives Pricing

The paper solves regime-switching models for affine and exponential-Lévy securities by reducing to one linear system, expanding the solution in mean holding time and pricing bonds, options, and credit instruments.

Fanfare 2Derivatives & VolatilityPeter CottonPDF

30

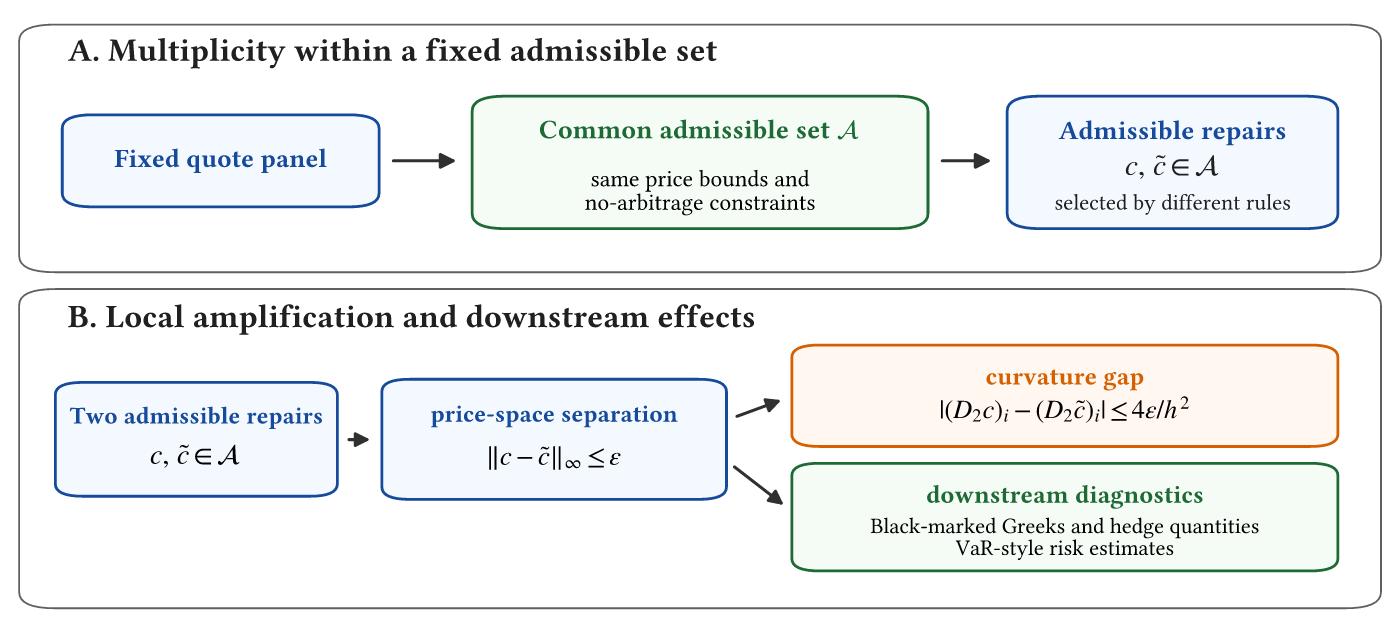
Repair Risk in Crypto Option Surfaces

Option-surface repairs that satisfy no-arbitrage constraints admit multiple admissible solutions, and finite-difference amplification causes downstream Greeks and risk measures to diverge substantially.

Fanfare 2Derivatives & VolatilityTenghan ZhongPDF

Fixed-set multiplicity and local amplification
Figure 1. Fixed-set multiplicity and local amplification. A fixed quote panel can admit multiple repairs in the same admissible set; normalized-price distance \varepsilo…

Econometrics & Forecasting5

16

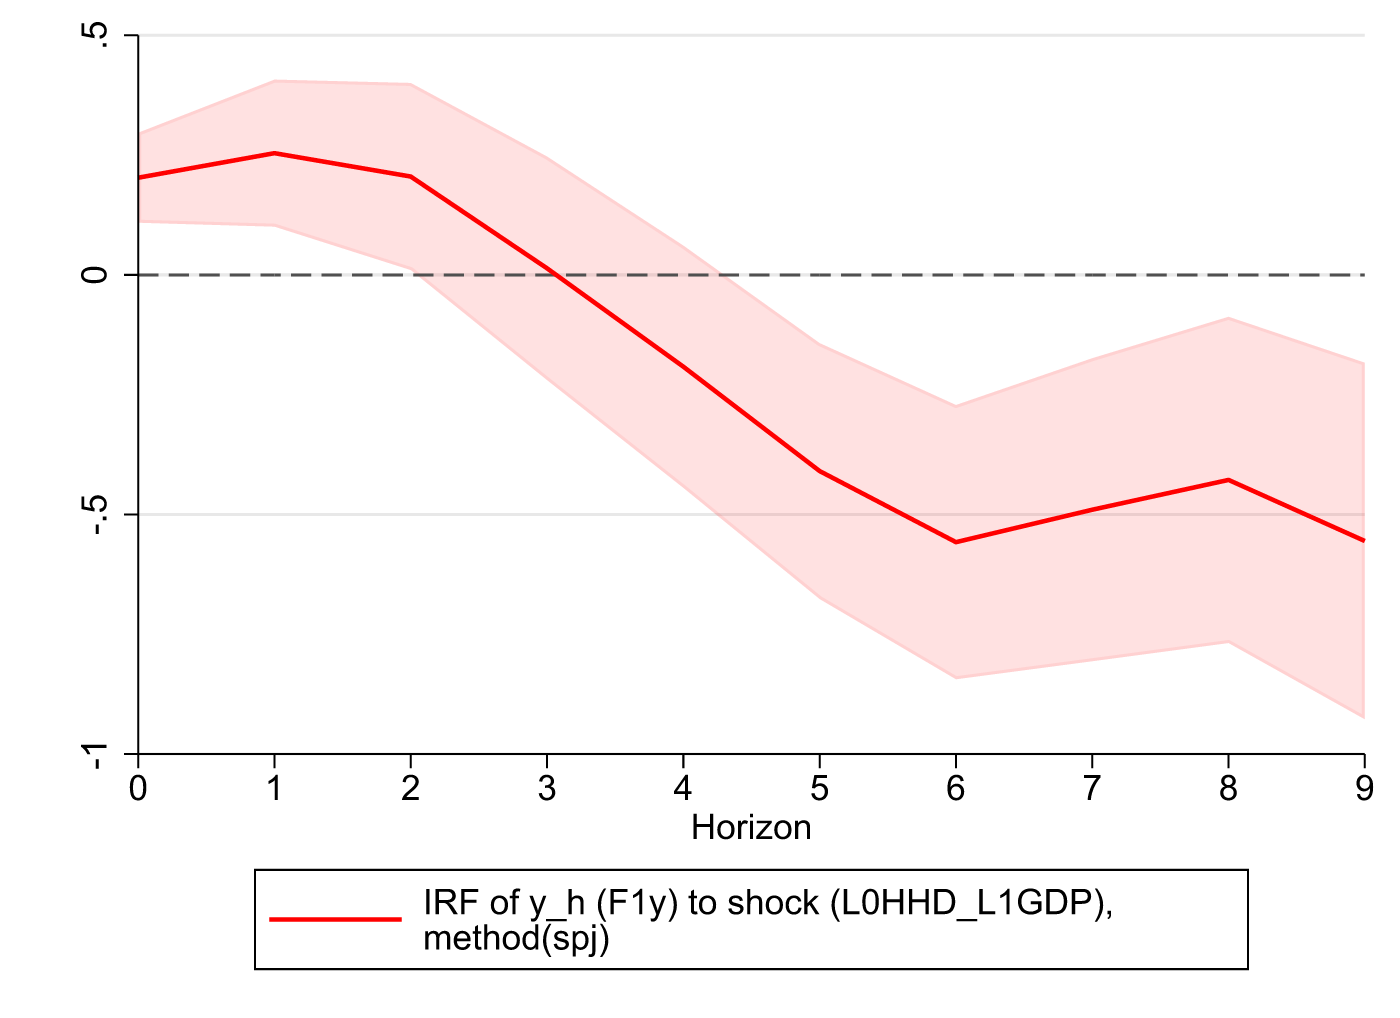
Panel LP Bias Correction in Stata

A new Stata command implements panel local projections with split-panel jackknife correction, removing the Nickell bias that invalidates standard inference in dynamic models across regions or countries.

Fanfare 3Econometrics & ForecastingShu Shen et al.PDF
Impulse responses of real GDP to household debt and nonfinancial firm debt
Figure 4 : Impulse responses of real GDP to household debt and nonfinancial firm debt
17

Panel VAR vs LP Convergence Rates

Panel VARs converge at the faster rate with N and T combined, while panel LPs converge only in T; the paper characterizes this efficiency-robustness trade-off and provides a test to choose between them.

Fanfare 3Econometrics & ForecastingMahmut Ablay et al.PDF
23

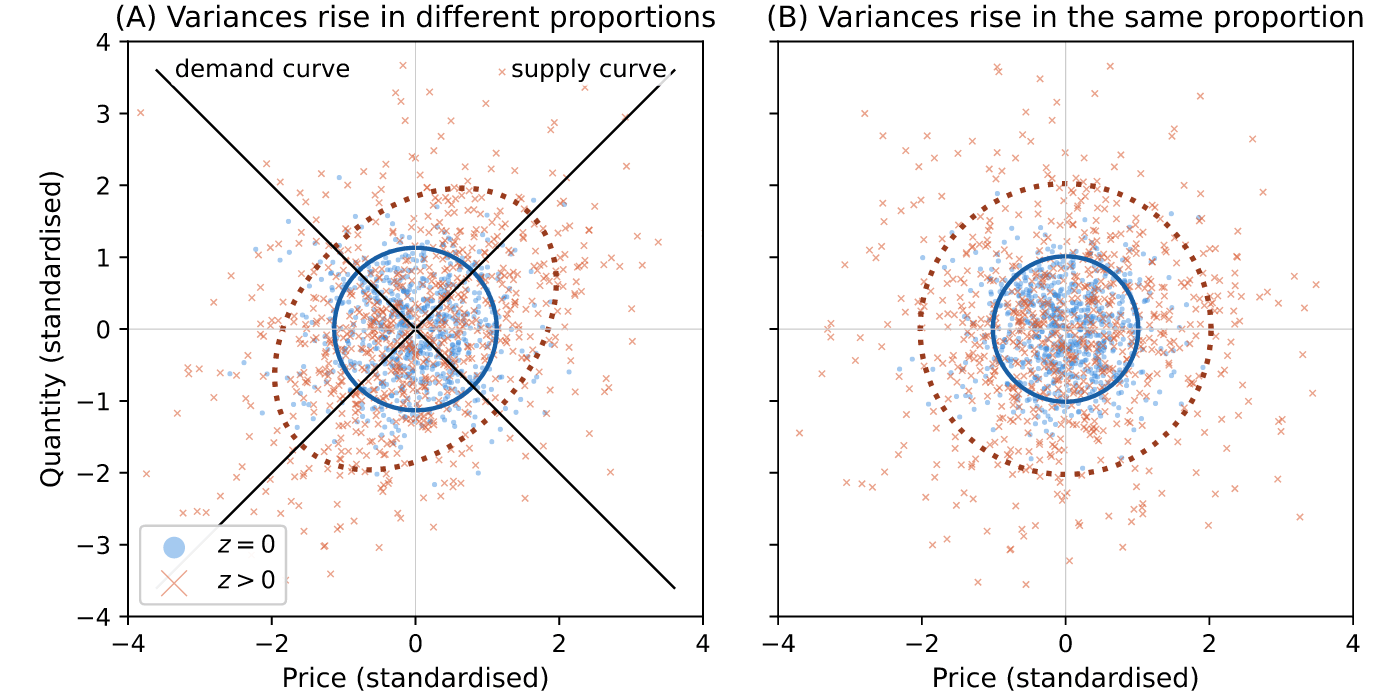
Identifying Shocks Through Heteroskedasticity

The study unifies identification results for structural shocks when variance paths differ, solving a generalized eigenvalue problem that nests prior work and clarifies what rank tests on second moments actually identify.

Fanfare 2Econometrics & ForecastingGeorge MilunovichPDF
Simulated price and quantity in the demand and supply example
Figure 1: Simulated price and quantity in the demand and supply example.
24

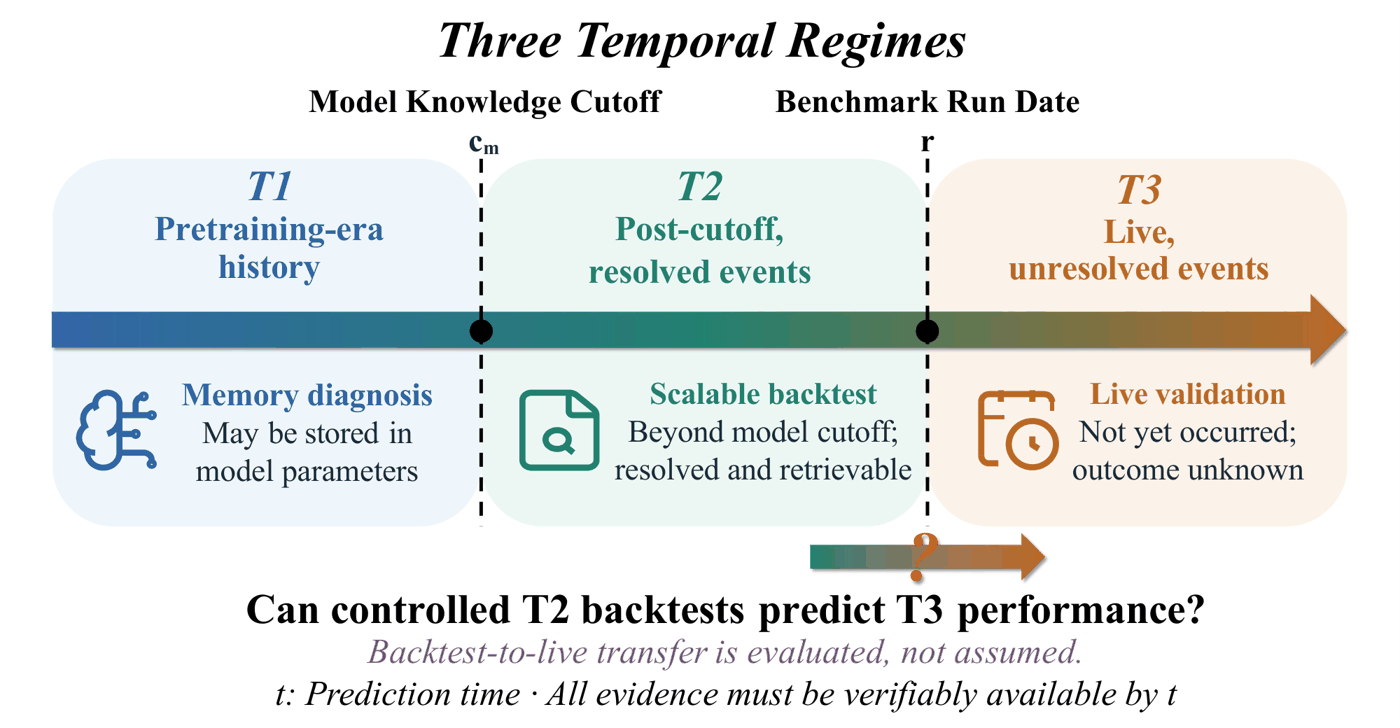
FinForesight: Financial Forecasting Benchmark

A diagnostic backtesting framework evaluates deep research systems on four financial forecasting tasks across three markets, with controlled information cutoffs to prevent information leakage and assess whether historical backtests predict live performance.

Fanfare 2Econometrics & ForecastingFengyuan Liu et al.PDF
Can controlled T2 backtests approximate T3 forecasting performance? The model knowledge cutoff c_{m} marks the T1/T2
Figure 1: Can controlled T2 backtests approximate T3 forecasting performance? The model knowledge cutoff c_{m} marks the T1/T2 boundary, and the benchmark run date r mar…
26

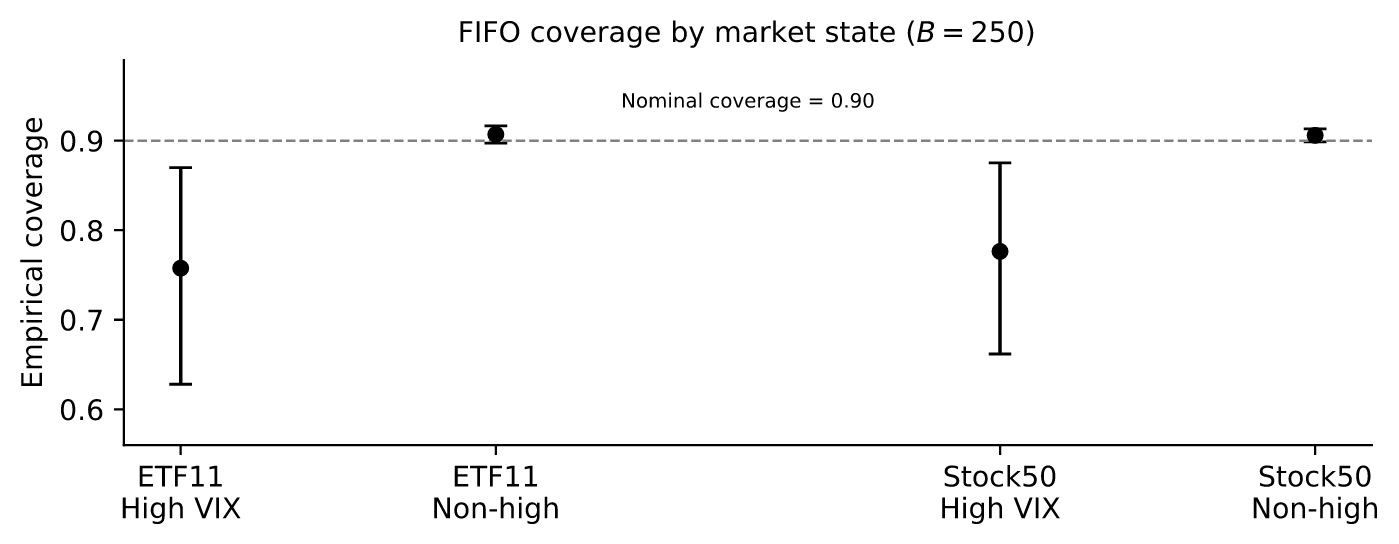
Bounded-Memory Forecast Intervals and Stress

Aggregate forecast-interval coverage can hide state-specific failures when economic regimes return after long absence; recent-only calibration undercovers during high volatility despite meeting overall targets.

Fanfare 2Econometrics & ForecastingRuihang Han and Li-Hsiang LinPDF
FIFO empirical coverage at B=250 . Points show asset-averaged coverage and vertical bars show pointwise 95% paired
Figure 1: FIFO empirical coverage at B=250 . Points show asset-averaged coverage and vertical bars show pointwise 95% paired circular block-bootstrap intervals with 20-d…

Also notable2

10

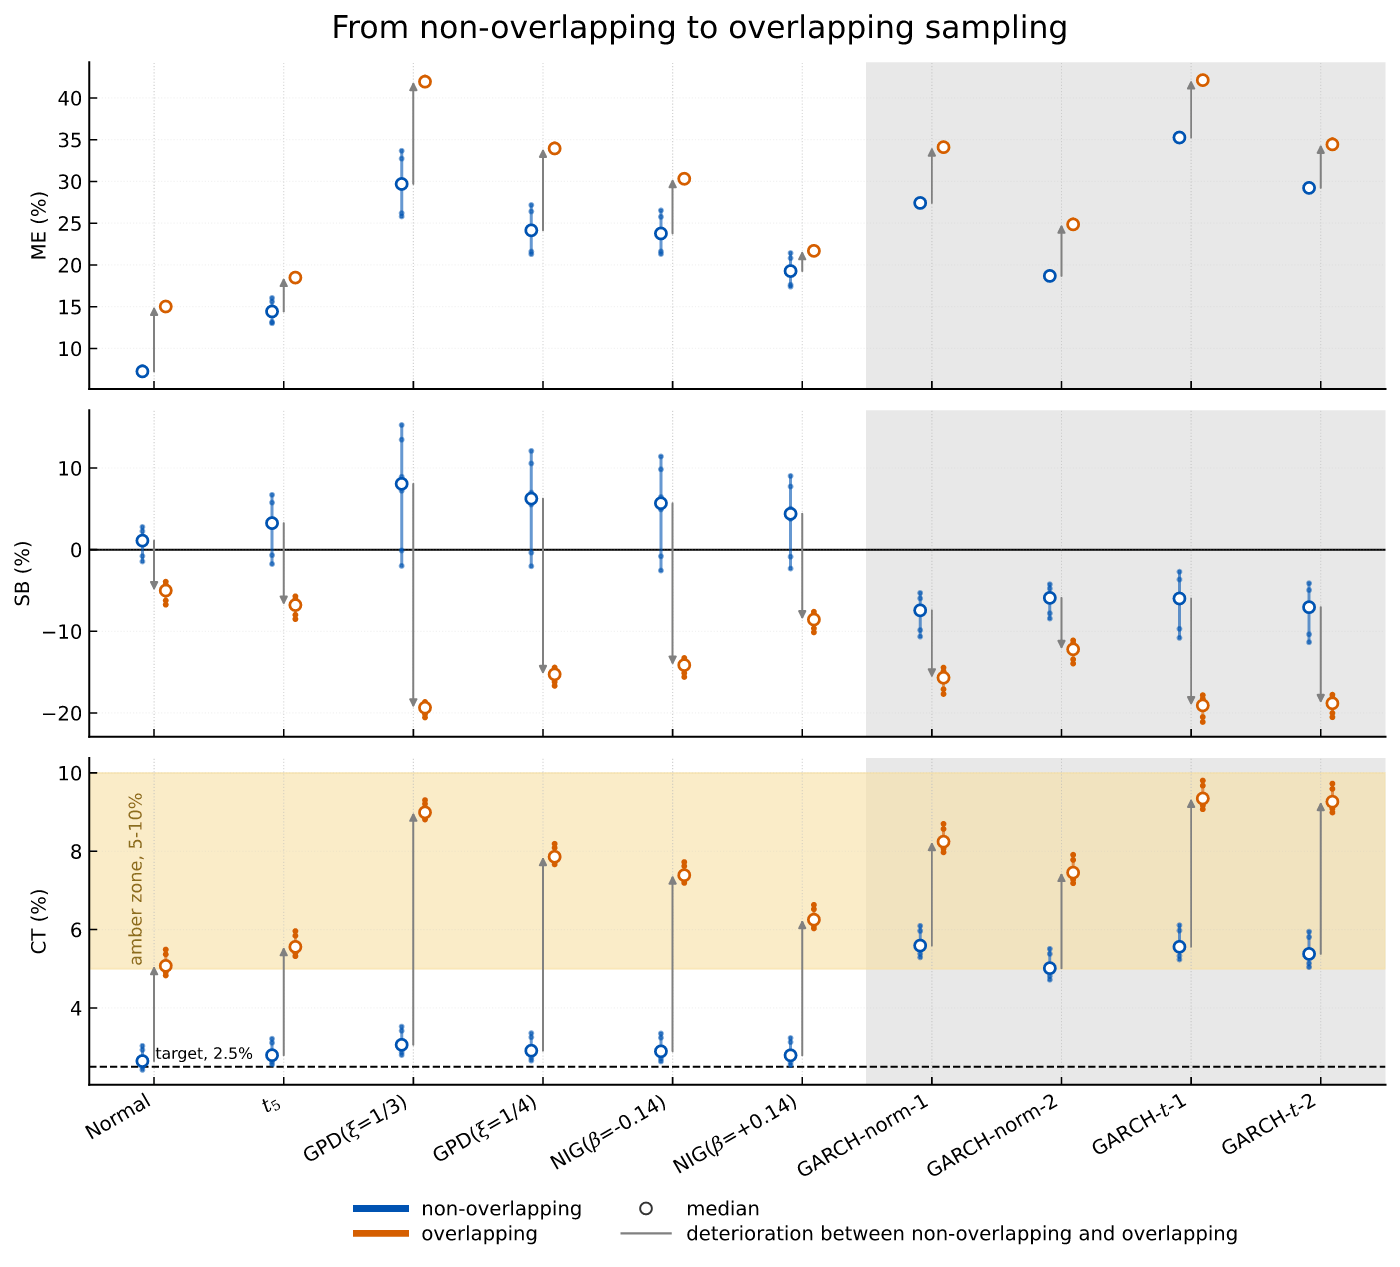
Expected Shortfall Under Overlapping Sampling

When estimating expected shortfall from overlapping multi-day returns, the mismatch with standard independent-sampling theory causes systematic downward bias that weakens capital coverage, especially under heavy tails.

Fanfare 3Risk, Credit & BankingMartin Aichele et al.PDF

Metric values comparing non-overlapping and overlapping sampling schemes across distributions.
Figure 1 : Metric values (range and median) across ES estimators #1–#6 for non-overlapping (blue) and overlapping (orange) schemes, by distribution (x-axis). ME (top), S…
12

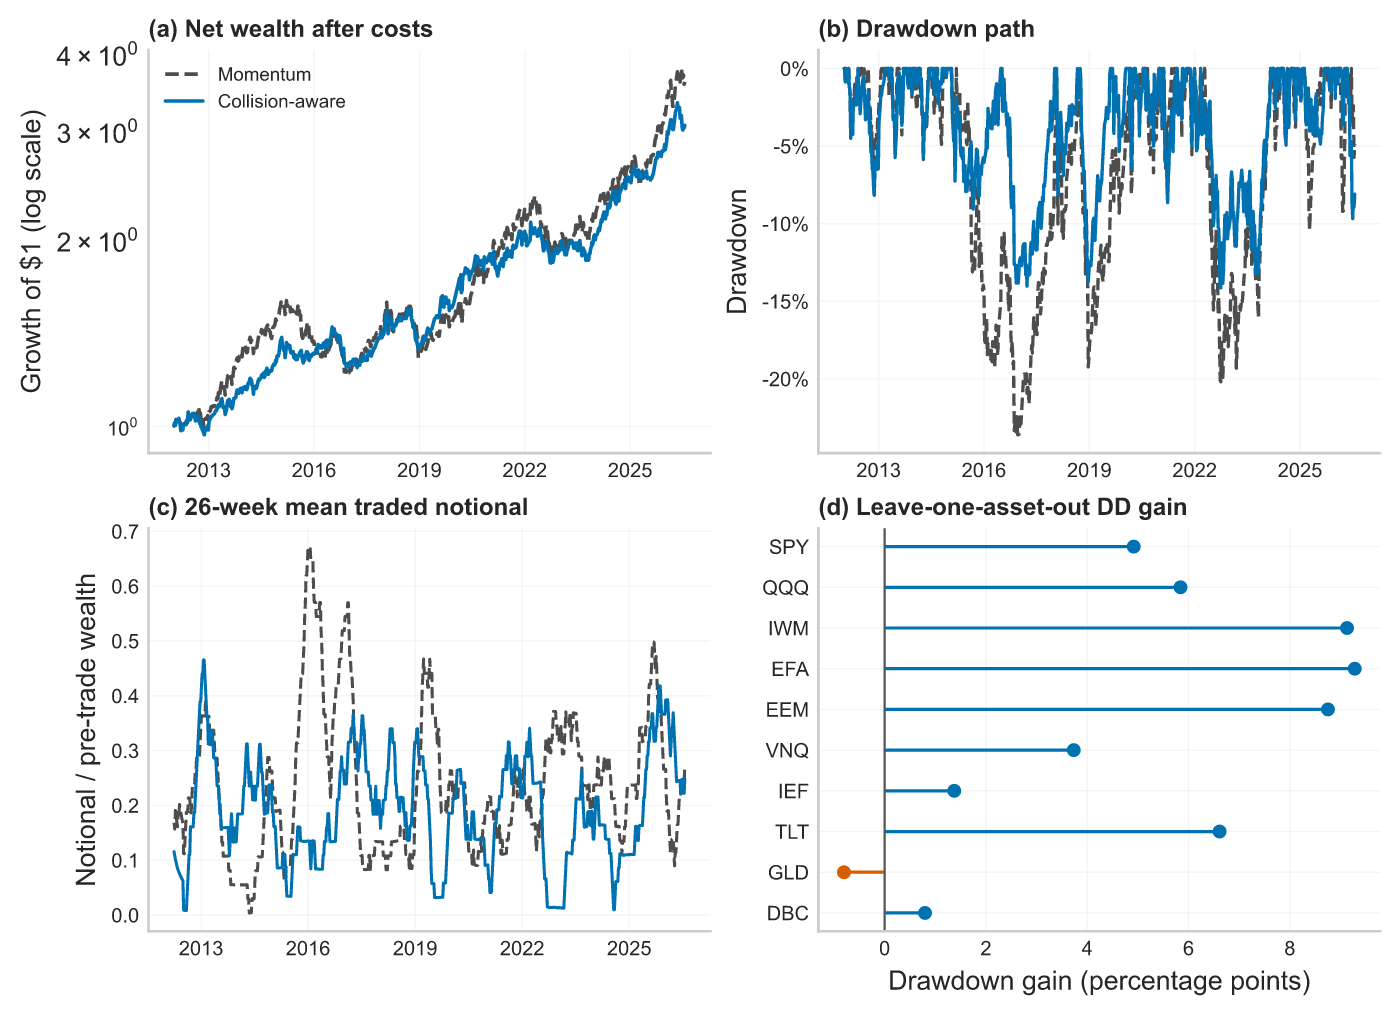
Penalizing Common Trades in Portfolio Models

A post-model layer that reduces portfolio concentration by penalizing shared exposures cuts maximum drawdown from 23.6% to 14.1% on a cross-asset test.

Fanfare 3Portfolio & AllocationEric Benhamou et al.PDF

The wrapper reduces the deepest realized loss and traded notional, while the asset-omission diagnostic retains the
Figure 1. The wrapper reduces the deepest realized loss and traded notional, while the asset-omission diagnostic retains the drawdown-gain sign in nine of ten universes.…

SSRN

New working papers in finance, economics and ML

30 papers · 1 figures

Portfolio & Allocation2

01

The Hidden Sharpe Ratio

The study estimates maximum Sharpe ratios in large cross-sections without constructing the efficient portfolio, finding annualized maximal Sharpe of 7.4 in U.S. equities versus benchmark estimates of 1.0 to 4.0.

Fanfare 4Portfolio & AllocationMikhail Chernov et al.

08

Risk-Budgeted Mean-Variance Portfolios

A convex optimization method combines risk budgeting with expected returns, delivering higher average returns than risk parity with lower turnover and concentration than traditional mean-variance portfolios.

Fanfare 3Portfolio & AllocationRaul Riva et al.

ML & AI Methods3

03

Reproducibility of ML Finance Papers

Testing 459 quantitative-finance machine-learning papers' released code, the study finds that execution success rates fall steeply due to environment and dependency issues, not link rot alone.

Fanfare 4ML & AI MethodsAkram Khan

12

LLM Memorization and Look-Ahead Bias

Large language models recall Indian firm financials from within their training data with accuracy that declines sharply for smaller firms, creating serious look-ahead bias in LLM-based backtests.

Fanfare 3ML & AI MethodsSethu Madhavan Chandavarapu

23

Green Tastes vs. Beliefs in AI Investors

Using language models as synthetic investors reveals institutional portfolios tilt greener despite weaker green tastes, and beliefs about green returns turn pessimistic after 2020.

Fanfare 3ML & AI MethodsXindi He and Lubos Pastor

Crypto & DeFi4

05

Point-in-Time LLM Sentiment on Crypto Returns

Headlines scored by LLM within minutes predict cross-sectional cryptocurrency returns with a daily long-short Sharpe of 2.21 until the signal decays.

Fanfare 3Crypto & DeFiALEKSANDR SENKEVICH

15

Tokenization's Hidden Cost to Price Discovery

NFT airdrops on Ethereum raise block fees and failure rates, shifting price discovery off-chain and impeding native-token information incorporation critical for proof-of-stake security.

Fanfare 3Crypto & DeFiAgostino Capponi et al.

26

Retail Crypto Returns Against Casino Odds

Memecoin traders get back 0.754 per unit staked, worse than any casino game, while perpetual futures and prediction markets match casino returns.

Fanfare 2Crypto & DeFiDaniel Gatto

27

Predicting Stablecoin Depegs

A gradient-boosted classifier trained on 219 USD-pegged stablecoins predicts which coins will lose their peg within one week, achieving 0.59 average precision on test data.

Fanfare 2Crypto & DeFiJude Enajero

Macro-Finance & Rates5

06

Monetary Policy Expectations of Hedge Funds

Fine-tuned LLM analysis of hedge fund letters reveals policy expectations that predict yield-curve moves beyond market rates and correlate with fund returns.

Fanfare 3Macro-Finance & RatesPatrick Coggi et al.

07

Monetary Policy Effects on Dividend Growth and Risk Premium

Using equity and risk-free rate term structures, monetary policy shocks affect both expected dividend growth and equity risk premium, with effects beyond duration matching.

Fanfare 3Macro-Finance & RatesJens Carsten Jackwerth and Benjamin Golez

19

Exchange Rates with Disagreeing Arbitrageurs

Models how wealth redistribution among arbitrageurs with different beliefs amplifies exchange rate volatility and generates interest-parity wedges, accounting for 62 percent of observed variance.

Fanfare 3Macro-Finance & RatesRikuto Onishi

22

Trade Exposure and Sovereign Risk

Research shows trade exposure determines whether commodity-price rises reduce or increase sovereign risk, with exporters gaining from higher prices and importers facing reinforced costs.

Fanfare 3Macro-Finance & RatesNaomi Cohen et al.

30

Quantitative Tightening in Segmented Markets

Models how central banks must retain more reserves for rate control when interbank trading cannot redistribute reserves across heterogeneous banks, even if aggregate demand is sufficient.

Fanfare 2Macro-Finance & RatesJunko Oguri and Cristoforo Pizzimenti

Asset Pricing & Factors3

09

Time-Series Momentum Decay and Long-Only Recovery

The classic TSMOM long-short premium has decayed to a zero net Sharpe, but a long-only volatility-targeted version across multiple horizons earns 0.58 with strong crisis protection.

Fanfare 3Asset Pricing & FactorsXianghui Fang

14

Firm Investment in Data Capital

Measuring data investment from earnings calls, the research shows data capital's share of investment reached about one-eighth in 2025 and commands a market premium of 12 dollars per dollar invested.

Fanfare 3Asset Pricing & FactorsZhenkai Ran et al.

21

Anchoring on Nominal Earnings Surprise

Shows that stock returns respond more to the same percentage surprise when reported earnings are larger in cents, consistent with anchoring on nominal rather than percentage earnings beats.

Fanfare 3Asset Pricing & FactorsPetrus H. Ferreira et al.

Risk, Credit & Banking5

10

Creditor Capacity and Debt Renewal

A 2021 life-insurer capital rule change shows that when incumbent creditors' capacity shrinks, corporate debt issuance falls and firms struggle to refinance maturing debt.

Fanfare 3Risk, Credit & BankingZiHao Ji et al.

11

Auto Loan ABS Data Shortcomings

Analysis of 19.8 million securitized auto loans reveals that reported data systematically understate risk through selection bias, carry-over reporting gaps, and priced-at-origination hidden credit differences.

Fanfare 3Risk, Credit & BankingPekka Honkanen et al.

16

Bank Shocks and Private Credit Lending

Private credit funds that borrow from banks transmit funding shocks to firm lending; following SVB's collapse, exposed banks increased credit-line commitments while cutting direct lending to nonfinancial firms.

Fanfare 3Risk, Credit & BankingManasa Gopal et al.

17

Short Squeezes in Corporate Bonds

The study identifies two types of squeezes in corporate bonds that degrade price discovery and returns, with lender squeezes predicting negative short-horizon returns and market squeezes predicting positive ones.

Fanfare 3Risk, Credit & BankingAngel Tengulov et al.

18

Corporate Bond ETF Creation Puzzle

Finds that authorized participants create corporate bond ETF shares at discounts to offload overvalued inventory, causing delivered bonds to underperform by 5.3 basis points.

Fanfare 3Risk, Credit & BankingYuan Zhou

Trading, Microstructure & Execution4

13

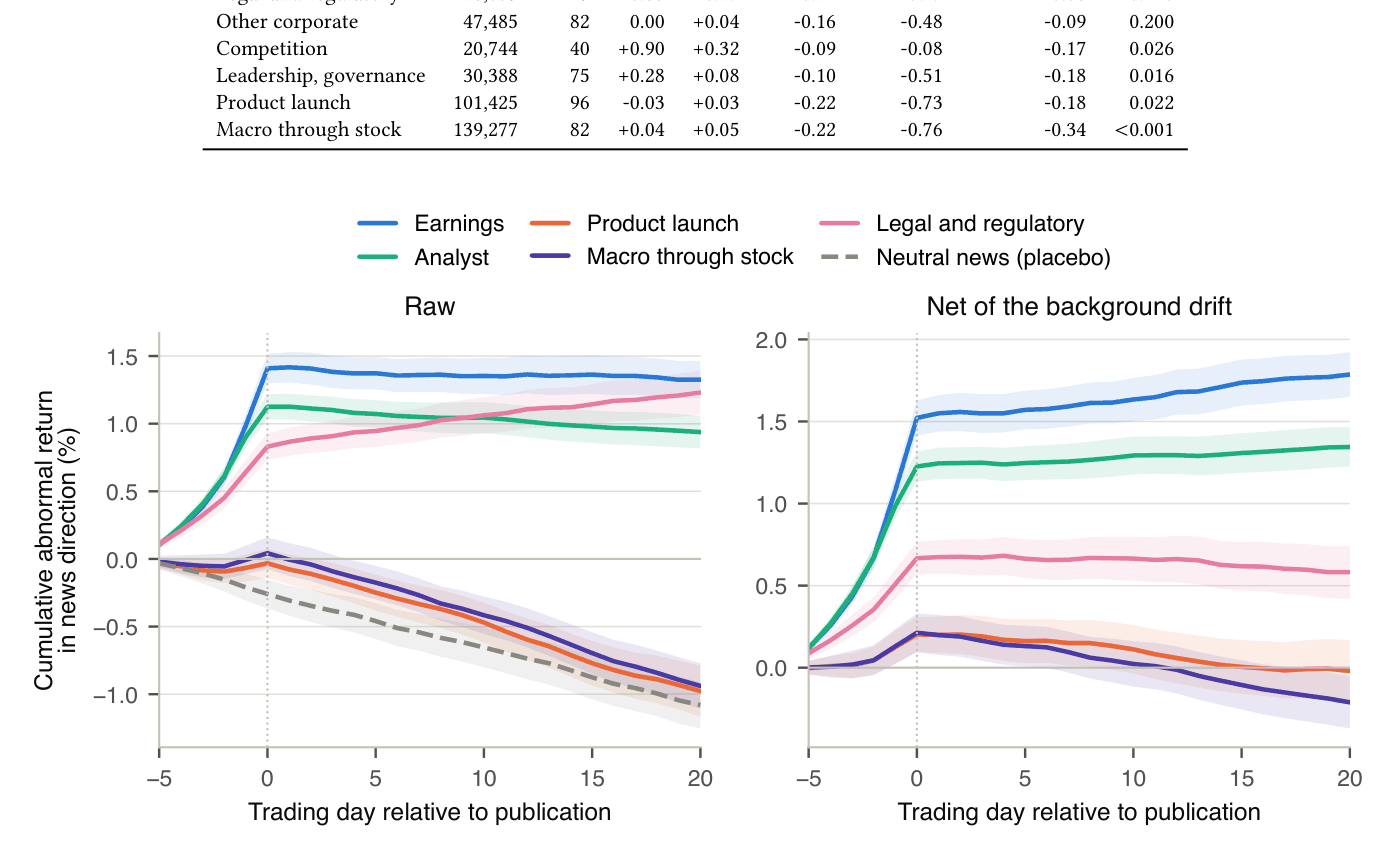
When Financial News Gets Priced In

Analyzing 1.68 million stock-day events from 4.57 million articles, the study finds that directional price moves concentrate before and at publication day, with little incremental return later.

Fanfare 3Trading, Microstructure & ExecutionAlireza Kargarzadeh et al.

Cumulative abnormal return in the news direction around publication (day 0), five event tags plus the neutral placebo
Figure 1: Cumulative abnormal return in the news direction around publication (day 0), five event tags plus the neutral placebo. Left: raw. Right: net of the background…
20

Congressional Trading Information Value

Using machine learning to map firm disclosures to congressional committee jurisdictions, finds no evidence that members earn abnormal returns from legislative access or committee hearings.

Fanfare 3Trading, Microstructure & ExecutionYuan Zhou

28

Informed Trading in Prediction Markets

A likelihood-ratio framework ranks wallets by their information content in binary prediction markets, separating ranking from multiple testing and validating the method through simulation.

Fanfare 2Trading, Microstructure & ExecutionAhura Azadi

29

Efficiency in Individual Prediction Contracts

Studying 244 resolved Kalshi markets, the research finds that efficiency is measurable ex post but not predictable ex ante, and naive trading strategies fail against market benchmarks.

Fanfare 2Trading, Microstructure & ExecutionCristina Bixhili

Derivatives & Volatility2

24

Physics-Enforced Network for Convenience Yield

A neural network that analytically enforces the Gibson-Schwartz PDE recovers commodity convenience yield from futures and avoided implausible estimates during the April 2020 WTI dislocation.

Fanfare 2Derivatives & VolatilityEvan Lynch

25

Volatility Surface Shape and Carry

Tests term-structure and skew trading signals in equity volatility from free public data, showing term-structure carry lifts Sharpe ratio to 2.94 but skew lacks sufficient historical data.

Fanfare 2Derivatives & VolatilityYasanji Ratnaike

Also notable2

02

AI Bias Toward ESG in Analysis

Following AI adoption, financial analysts revise high-ESG forecasts upward and become more bullish, but forecast accuracy deteriorates and errors rise for top-ESG firms.

Fanfare 4LLMs & TextTong Li et al.

04

Information Coefficient Sample Size Limits

Cross-sectional IC volatility has a floor from factor risk that does not shrink with breadth, capping effective sample size at roughly fifty observations.

Fanfare 4Econometrics & ForecastingHimal Naidu

RePEc

Working papers curated by RePEc's NEP field reports

30 papers · 23 figures

ML & AI Methods5

01

Newspaper Reasons Explain Returns

Wall Street Journal market summaries explain 30-40% of daily and monthly returns out of sample when filtered for stated reasons, compared to under 10% for macro variables.

Fanfare 4ML & AI MethodsBryan T. Kelly et al.PDF

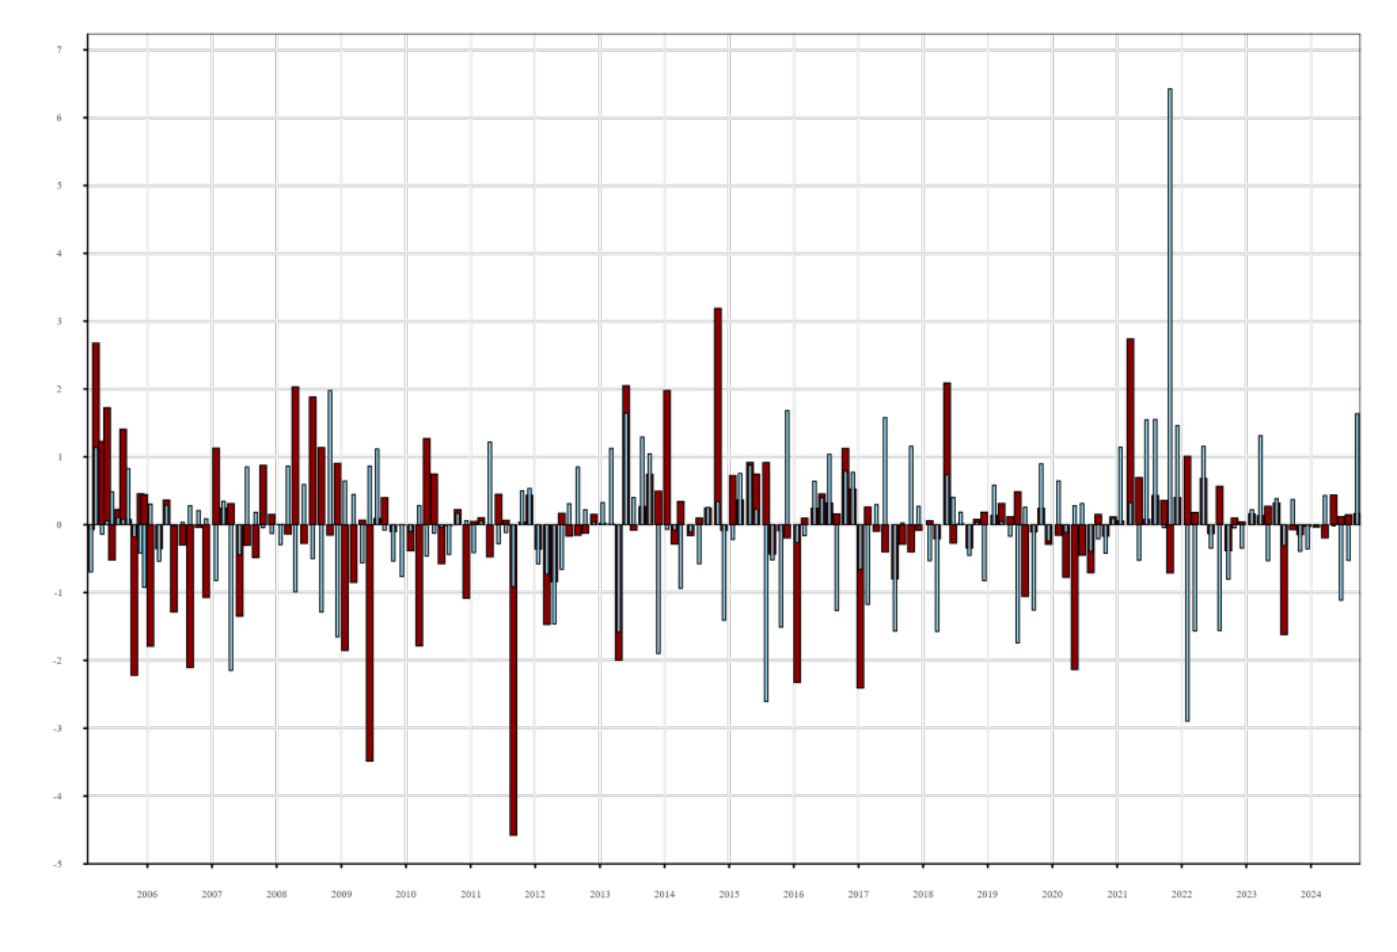
Monetary policy expansionary and contractionary periods overlaid with interest rate movements over time.
Figure 7: Expansionary and contractionary monetary-policy reasons with interest rates
04

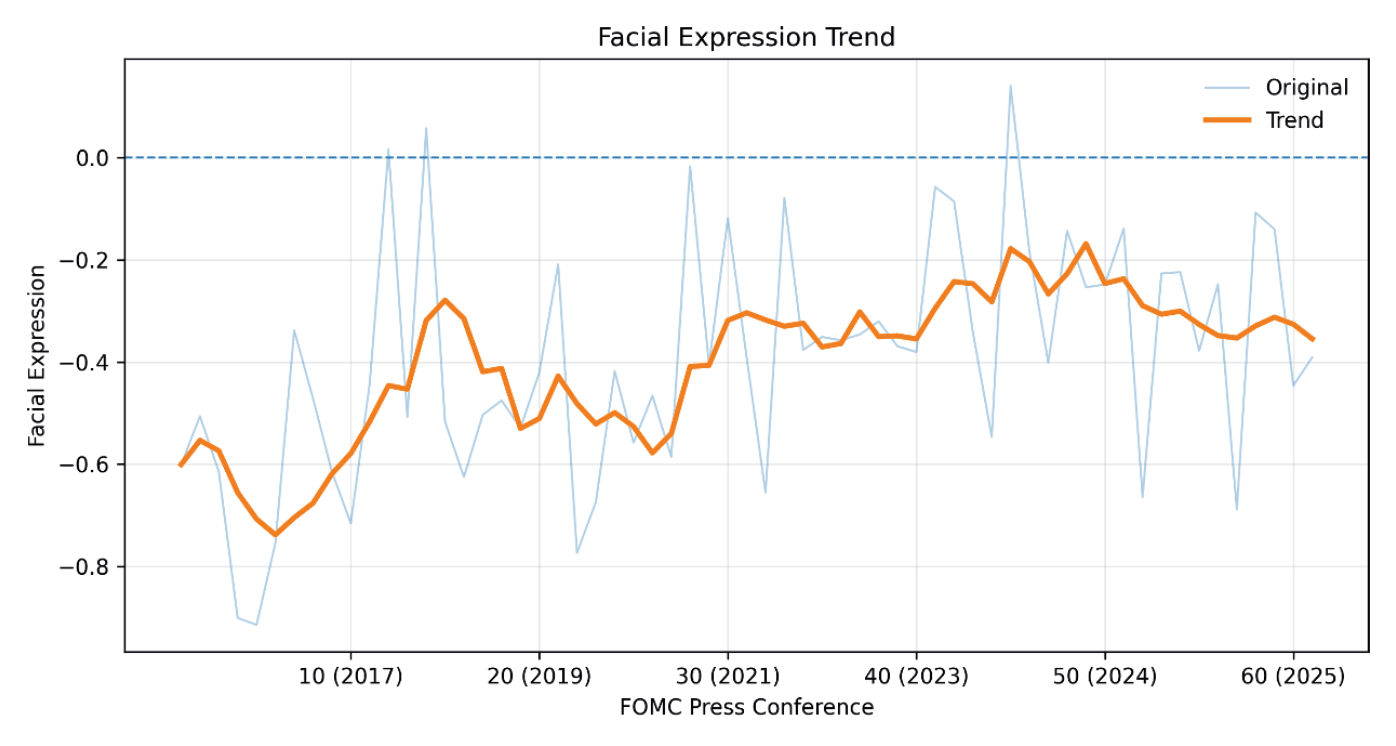
Fed Chair Emotions Affect Global Markets

Facial and textual emotions from Fed Chair press conferences generate immediate effects on foreign exchange and equity returns, with non-additive cross-modal interactions.

Fanfare 3ML & AI MethodsYiru Chen et al.PDF

Meeting-Level Facial Expression Index and Its Five-Meeting Moving Average
Figure 3. Meeting-Level Facial Expression Index and Its Five-Meeting Moving Average. Notes: The figure shows the meeting-level facial expression index over the sample pe…
05

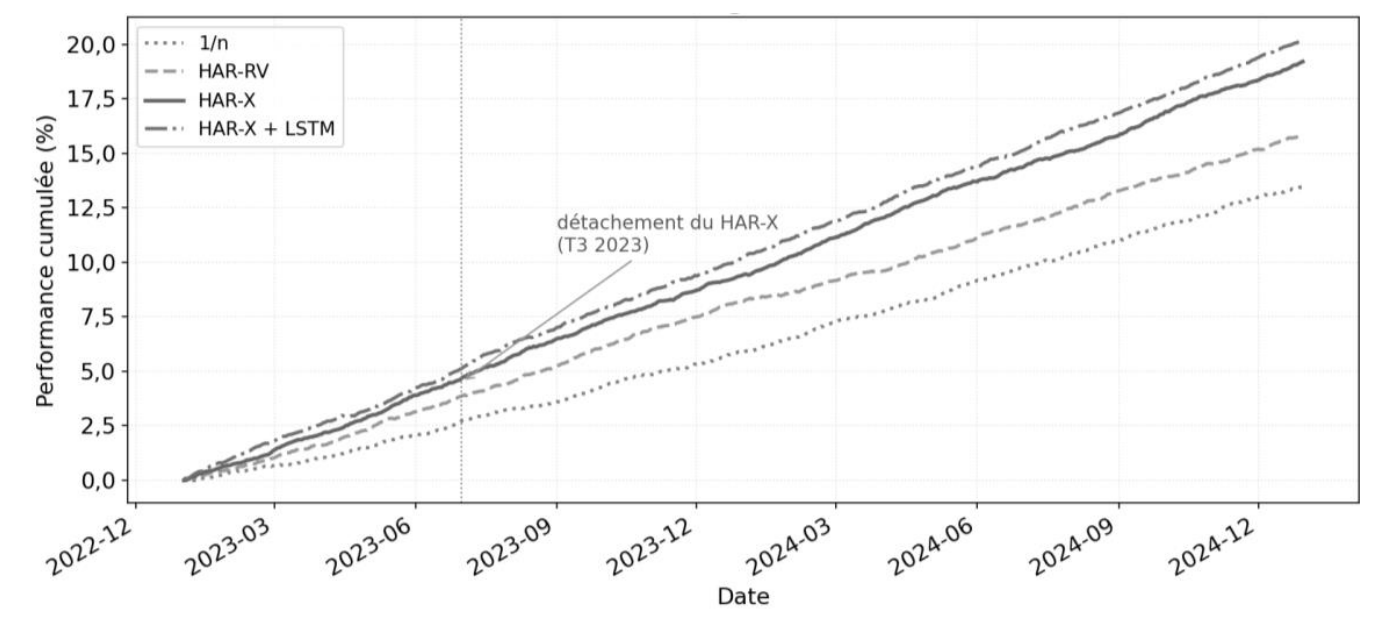
Multilingual Text for Volatility Forecasting

A hybrid FinBERT-HAR-X framework using multilingual news reduces S&P 500 volatility forecast error by 21% and improves realized Sharpe ratios out of sample.

Fanfare 3ML & AI MethodsSara Boughanou and Adil El MarhoumPDF

Out-of-sample cumulative performance of allocation strategies comparing HAR-X variants from 2022-2024.
Figure 11 : Performance cumulée hors-échantillon des stratégies d’allocation (2023-2024)
06

Investor Disagreement from Language Models

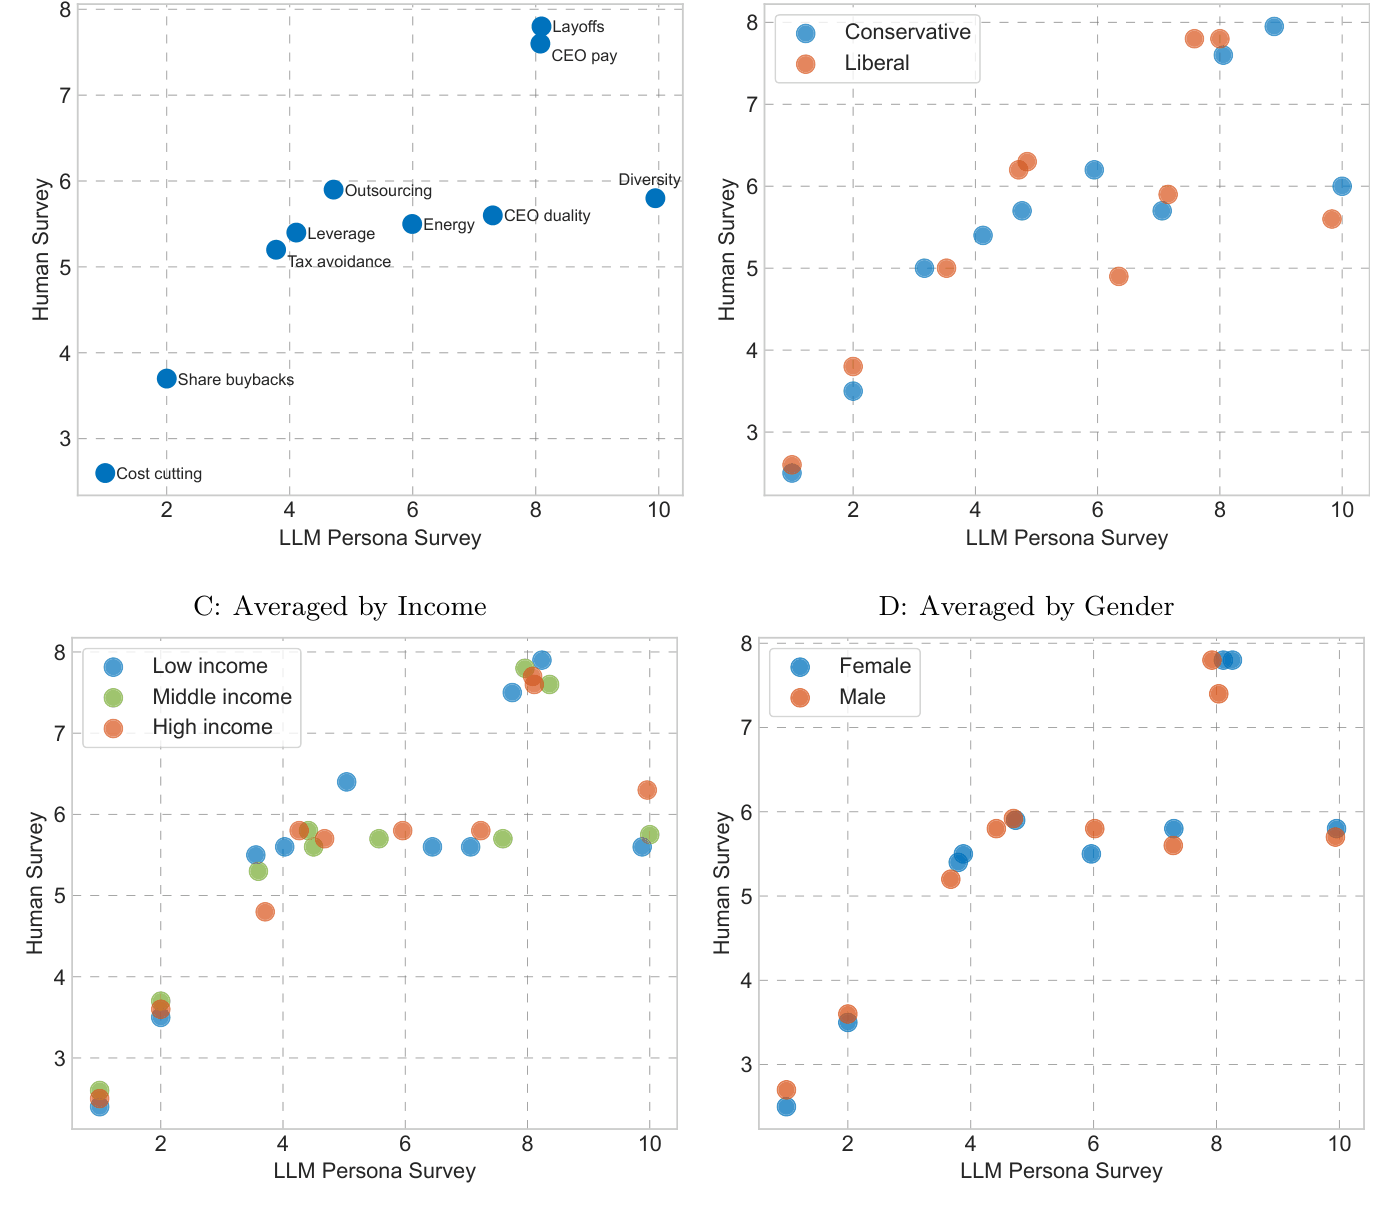
Using LLM personas, disagreement over news headlines predicts trading volume, with income and education disagreement most predictive and fundamentals generating least disagreement.

Fanfare 3ML & AI MethodsVineet Bhagwat et al.PDF

LLM Persona Responses Closely Match Human Responses Out of Sample
Figure 6: LLM Persona Responses Closely Match Human Responses Out of Sample. This figure reports a synthetic replication of human survey responses using Llama persona re…
19

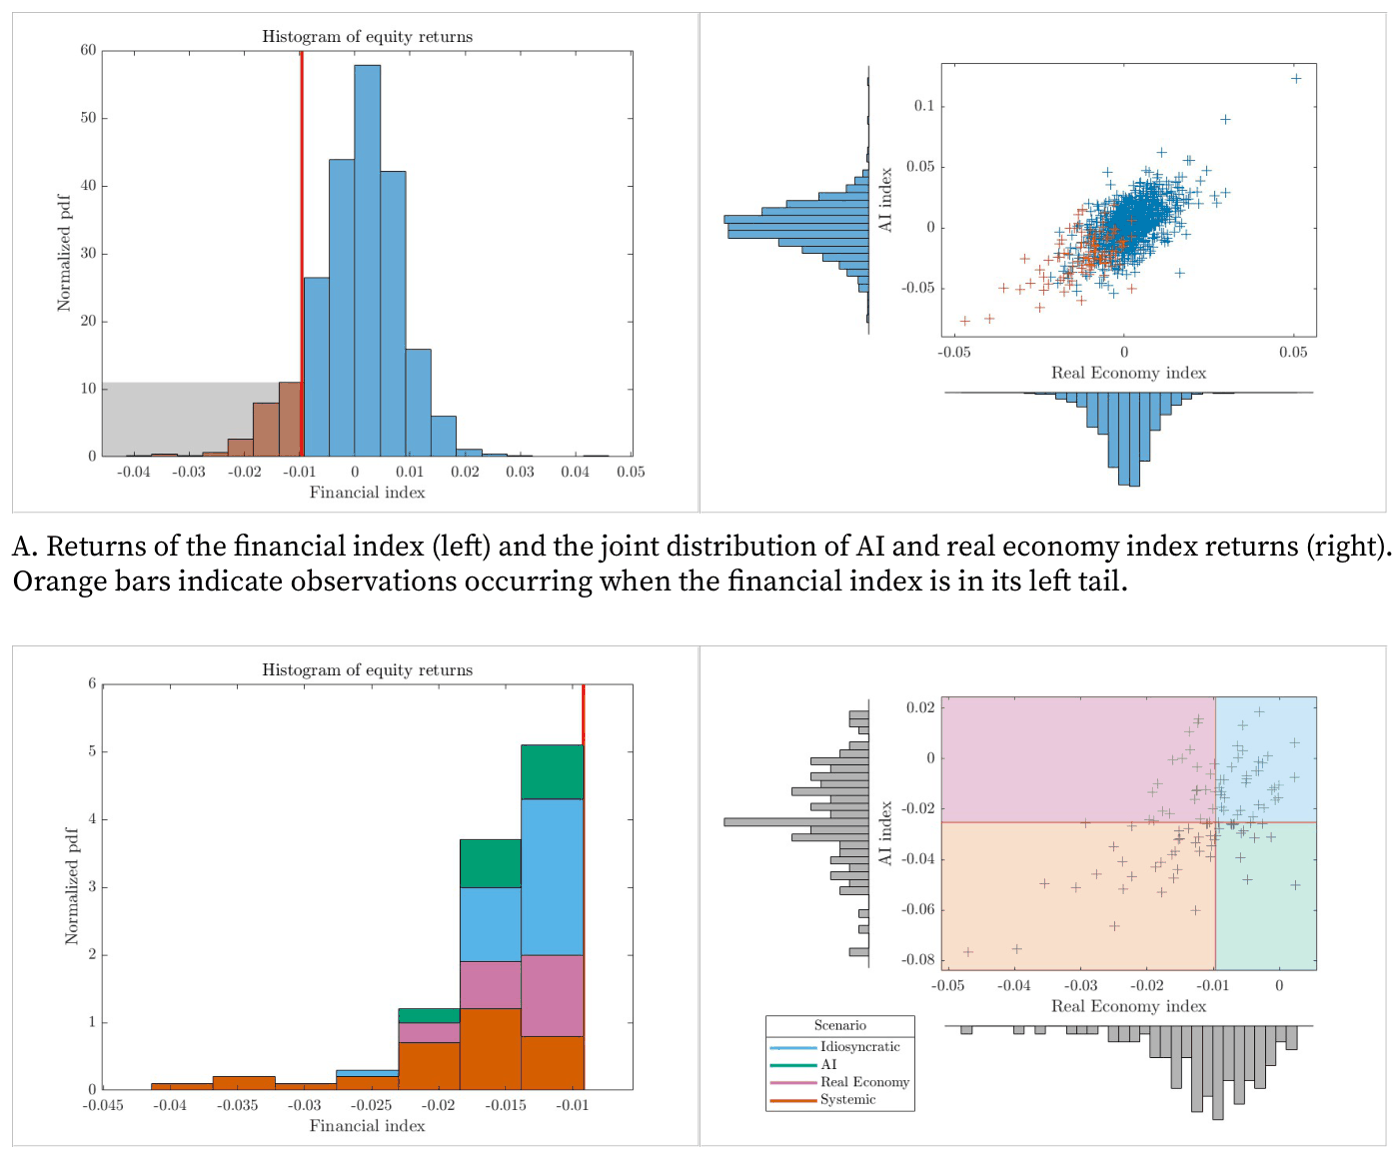
AI Exposure and Financial Sector Tails

AI-scenario contributions to financial-sector tail risk vary substantially by country, with downside asymmetry in Europe and the UK but limited impact in North America.

Fanfare 2ML & AI MethodsJavier Ojea Ferreiro et al.PDF

Concept of the Expected Shortfall decomposition
FIGURE 1. Concept of the Expected Shortfall decomposition.

Econometrics & Forecasting7

02

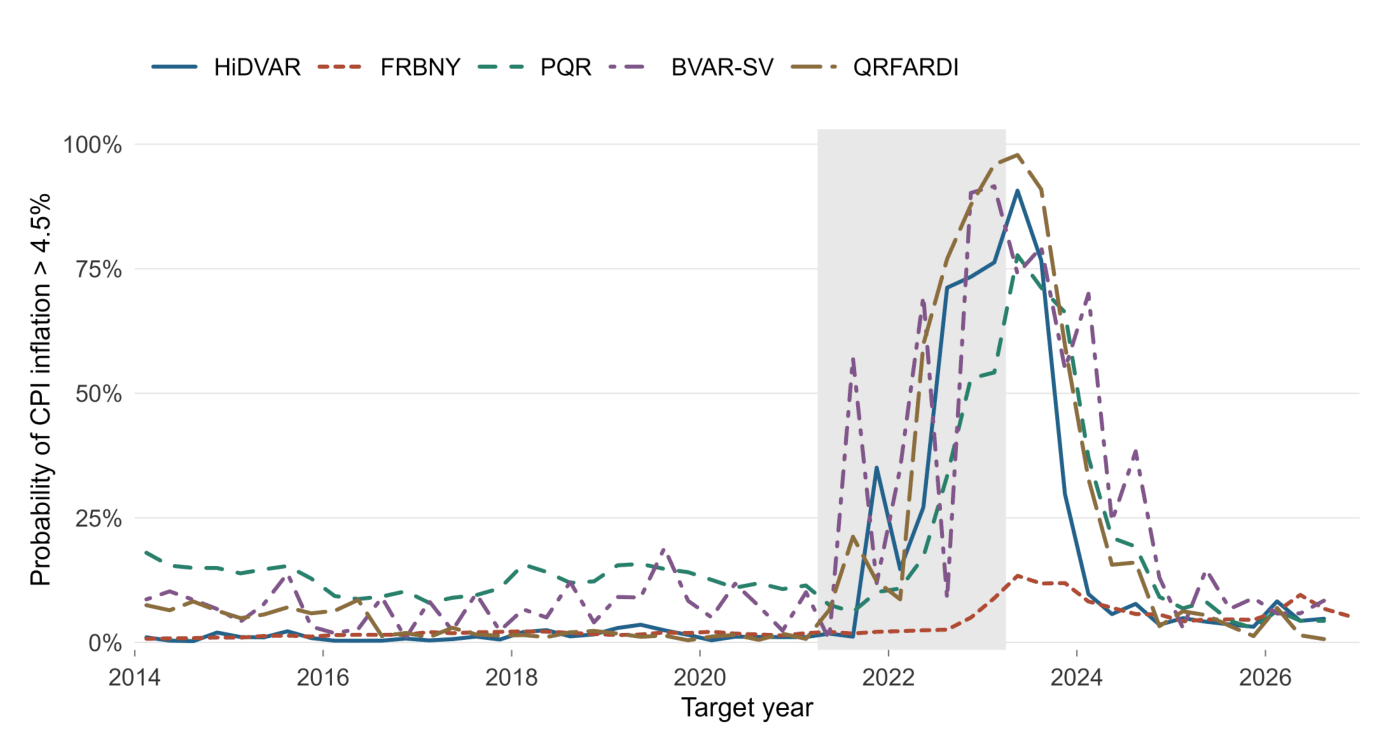
High-Dimensional Distributional VAR

HiDVAR, a data-rich distributional framework, improves inflation tail-risk assessment by 28% in CRPS relative to standard benchmarks and performs well in real-time evaluation.

Fanfare 4Econometrics & ForecastingLuca SchmitzPDF

Predicted Probabilities of Inflation surpassing 4.5%
Figure 15: Predicted Probabilities of Inflation surpassing 4.5%
11

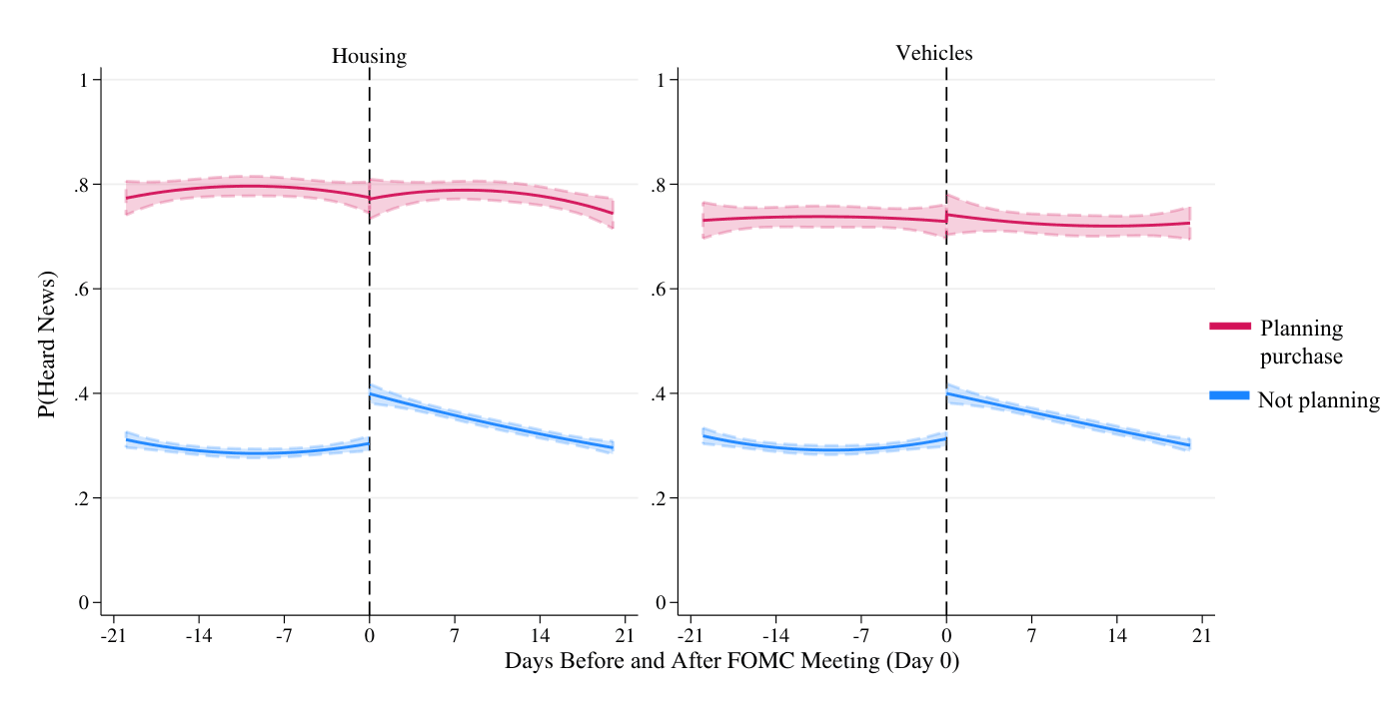
Consumer Attention to Monetary Policy

Survey of 170,000 consumers shows that attention to monetary policy is driven by incentives; those planning major purchases are significantly more attentive to interest rate news.

Fanfare 3Econometrics & ForecastingIna Hajdini et al.PDF

Attention to monetary policy spikes around FOMC meetings for consumers planning major purchases
Figure 1: Attention to Monetary Policy Around FOMC Meetings by Skin in the Game
12

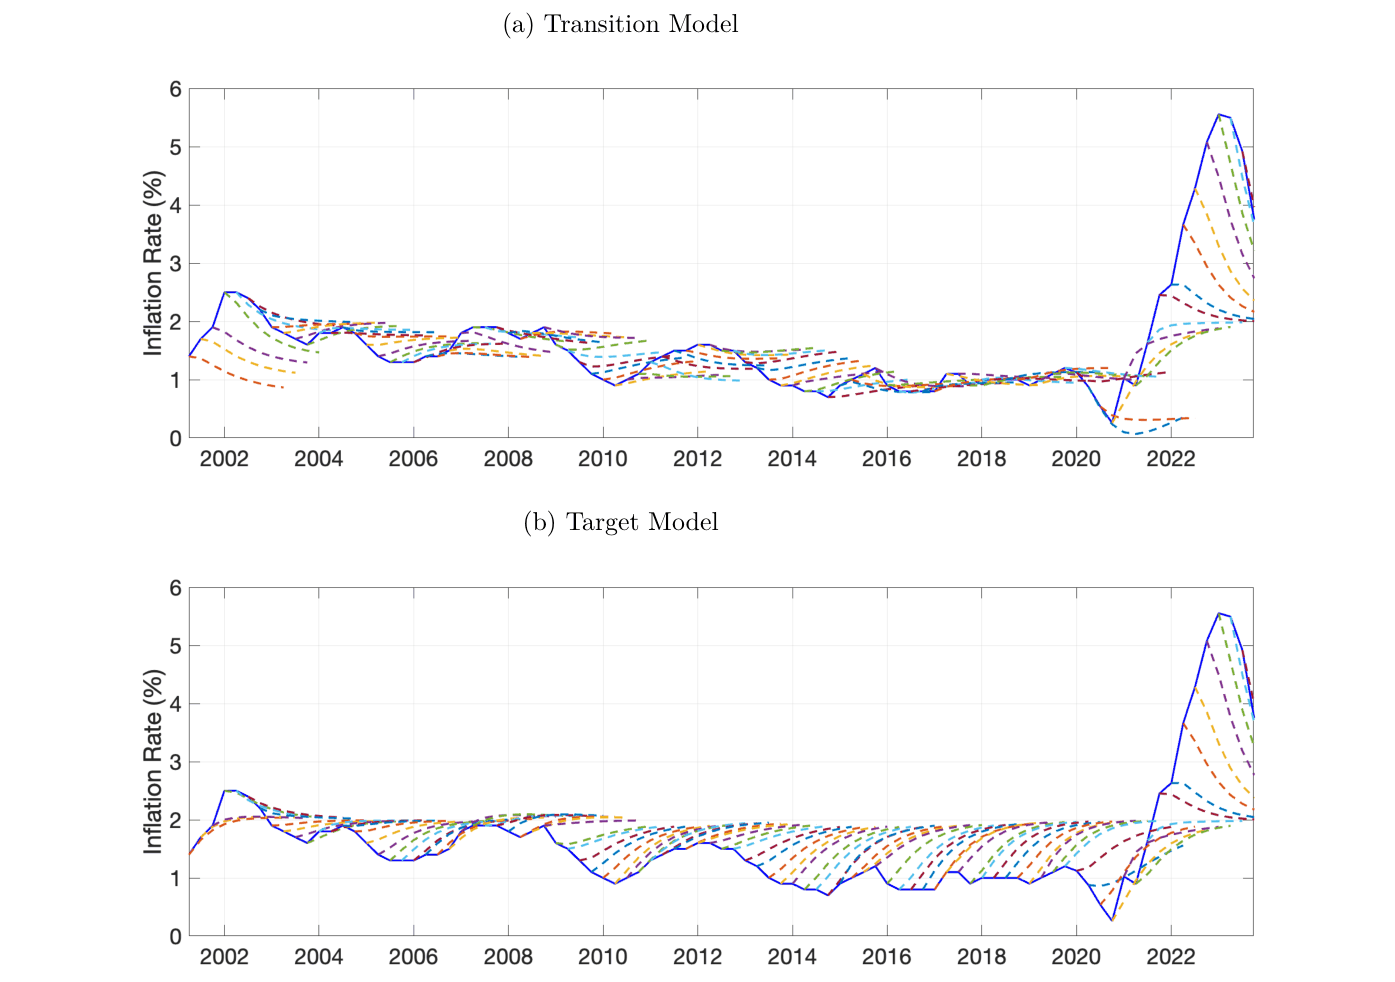
Inflation Forecasting with Expectation De-Anchoring

A model allowing expectations to shift to a low-inflation equilibrium cuts forecast errors roughly 50 percent versus central bank projections for euro area core inflation in the 2010s.

Fanfare 3Econometrics & ForecastingAlicia Pita Marcet et al.PDF

Euro area core inflation forecasts comparing transition and target models with uncertainty bands.
Figure 2: Core Inflation Forecasts, Euro Area, Year-on-Year
13

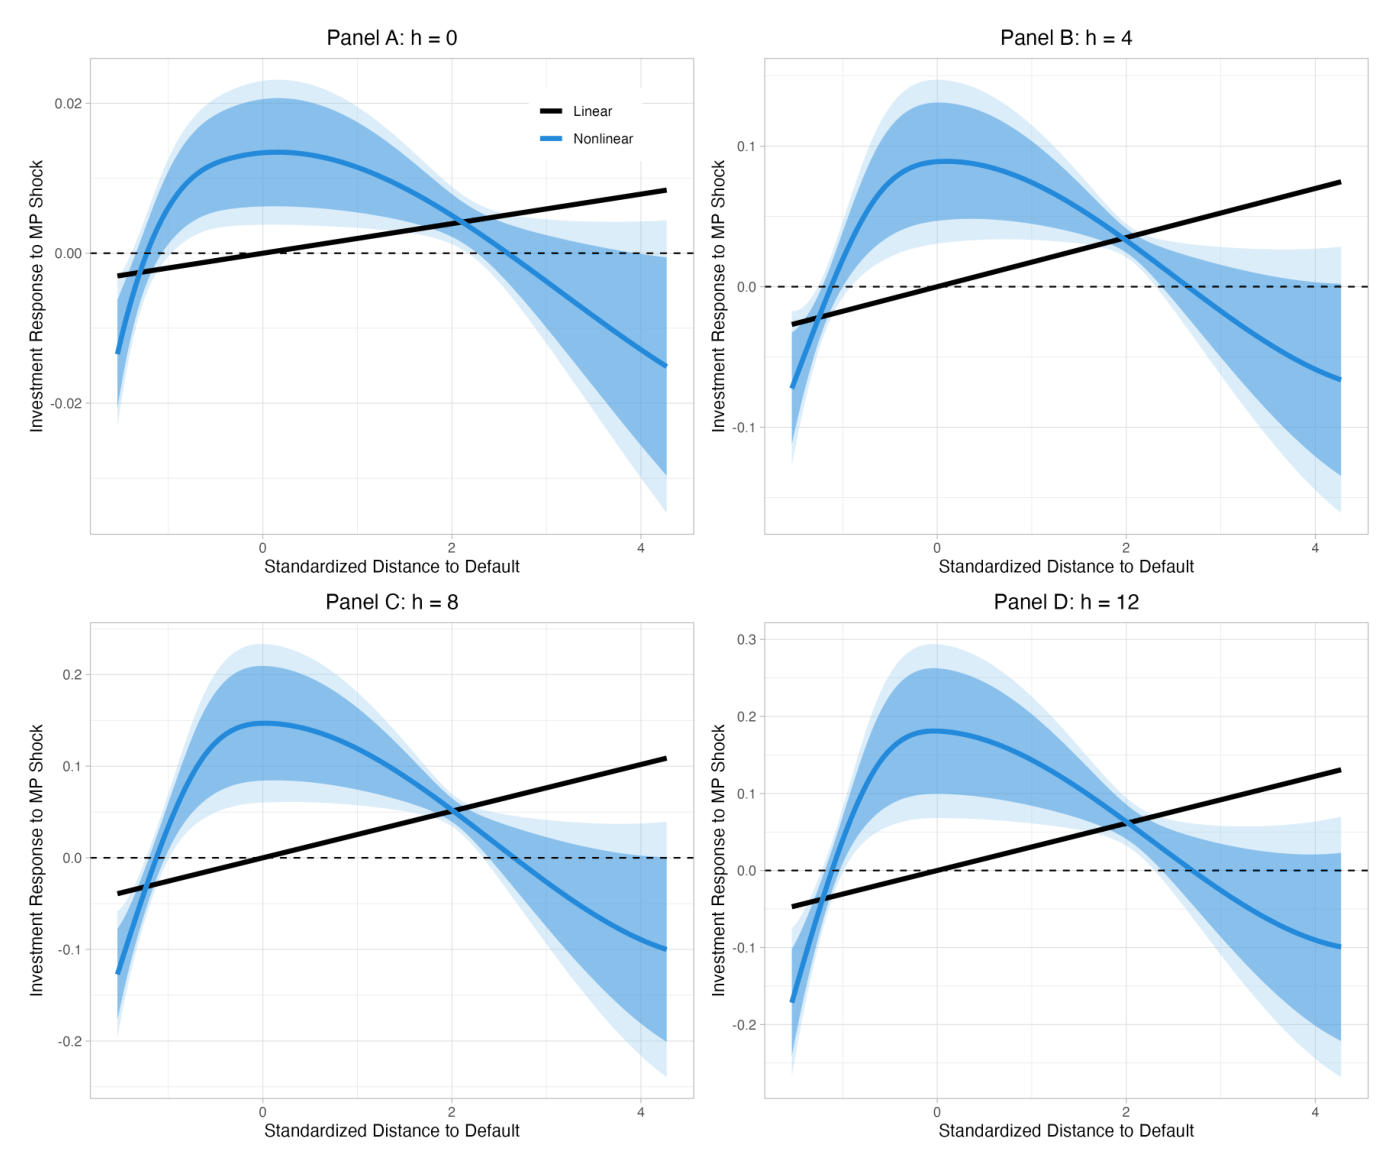
State-Dependent Local Projections for Shocks

The study develops nonparametric local projections to identify how economic shocks affect outcomes differently across states, uncovering a hump-shaped investment response to monetary policy that linear methods understate.

Fanfare 3Econometrics & ForecastingJoel M. David et al.PDF

Impulse Response of Firm-Level Investment to a Monetary Policy Shock
Figure 3: Impulse Response of Firm-Level Investment to a Monetary Policy Shock
14

News Shocks and Inflation in Open Economies

Large oil discoveries with production lags of five years show that anticipated future output raises core inflation a decade ahead, with effects concentrated in nontradables under fixed exchange rates.

Fanfare 3Econometrics & ForecastingBohou Cai et al.PDF

16

Emotions and Inflation Expectations by Income

Lower-income households form inflation beliefs two and a half times more sensitive to their emotional state than higher-income households, affecting expectations substantially independent of fundamentals.

Fanfare 3Econometrics & ForecastingShahdah Hanif and Wali UllahPDF

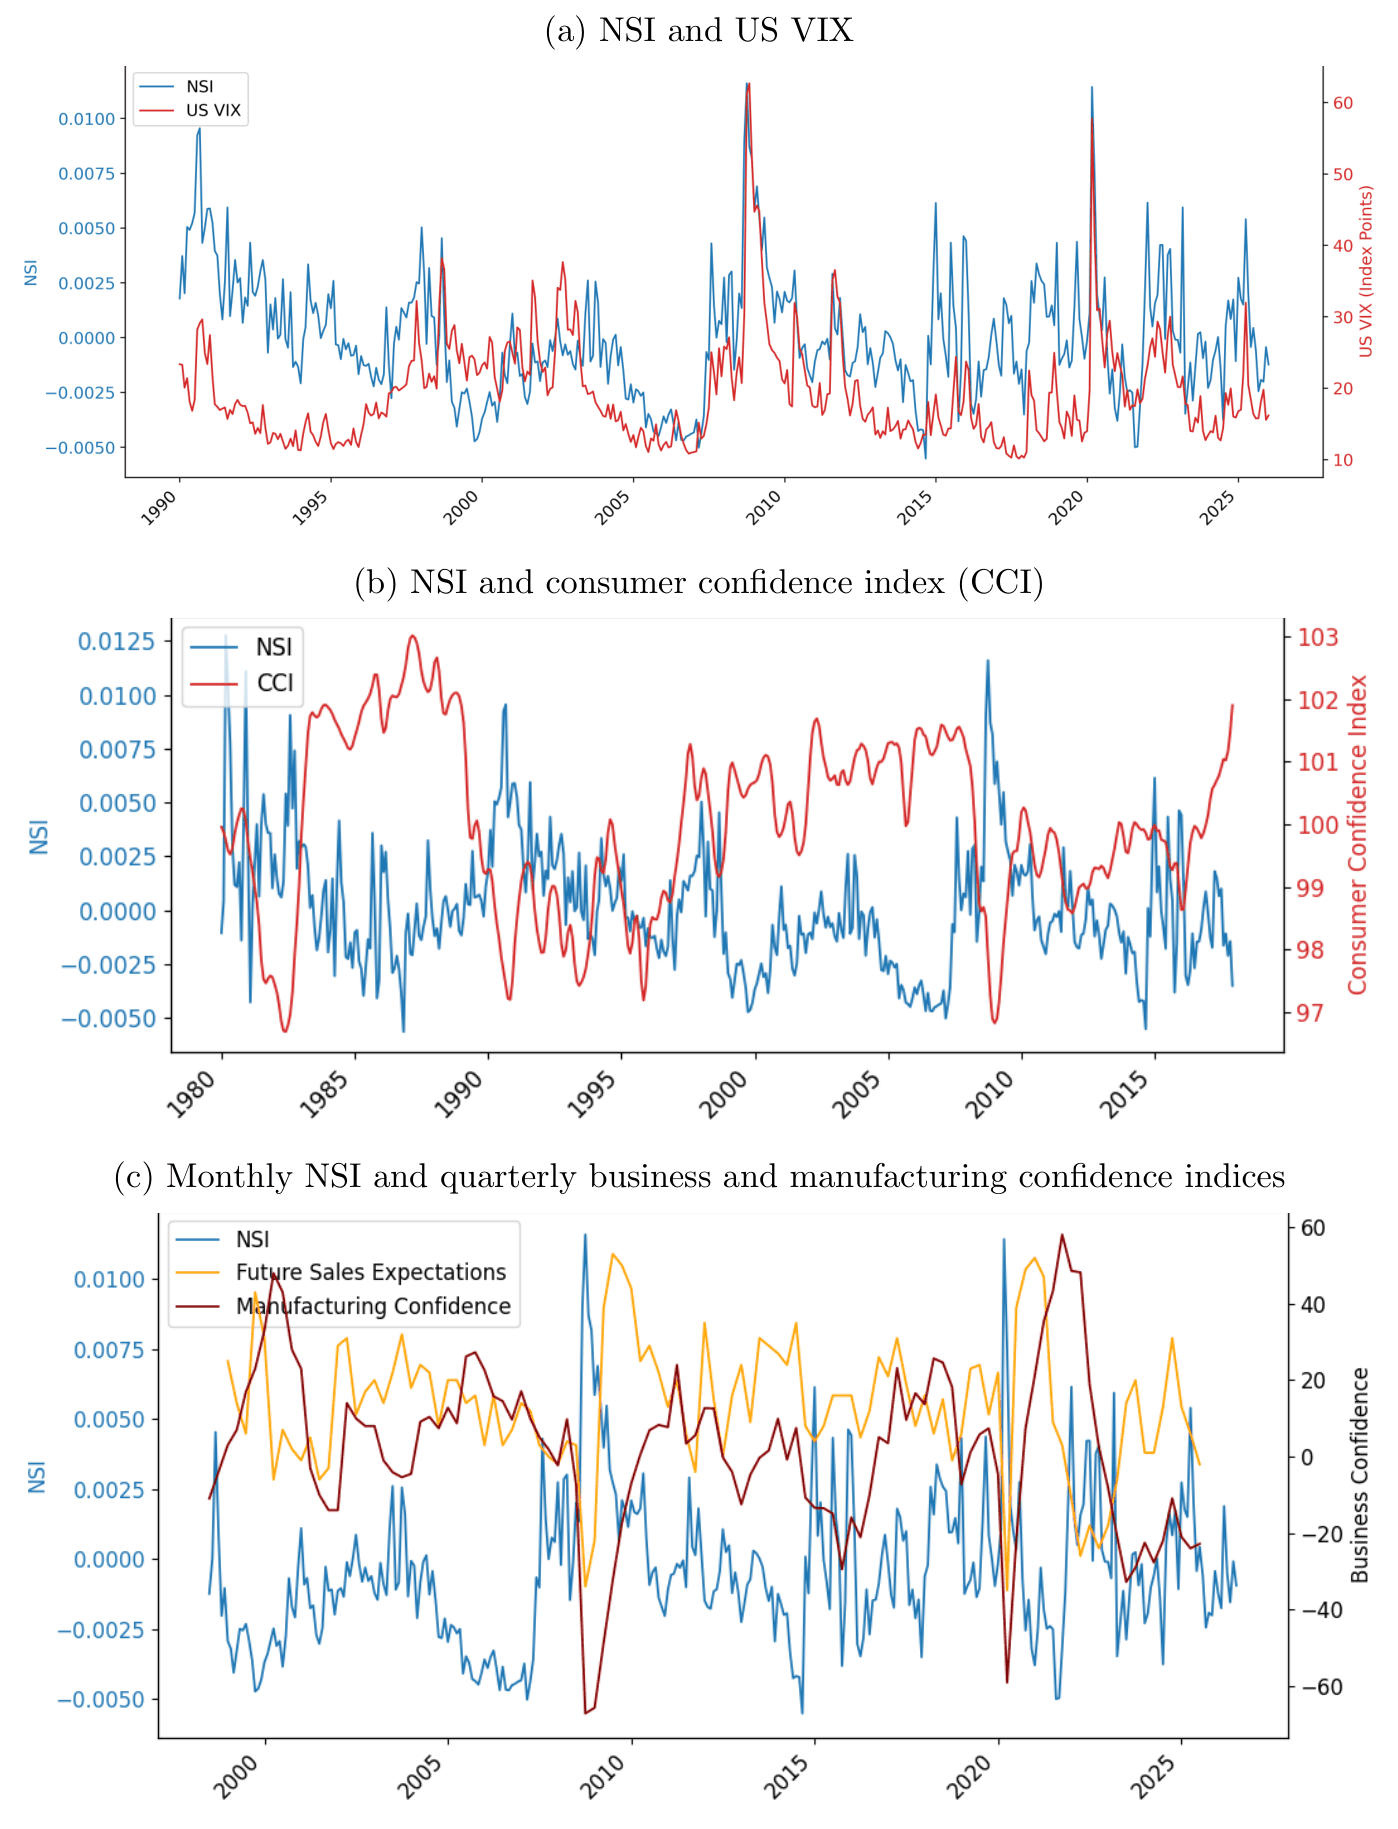
22

News-Based Measure of Perceived Financial Stress

A news-based stress index for Canada reveals that perceived financial stress operates through household precautionary behavior, independently of market-based financial shocks.

Fanfare 2Econometrics & ForecastingBrett Barnes et al.PDF

News stress index compared with VIX, consumer confidence, and business confidence over time.
Figure 5: NSI and macro-financial indicators

Crypto & DeFi2

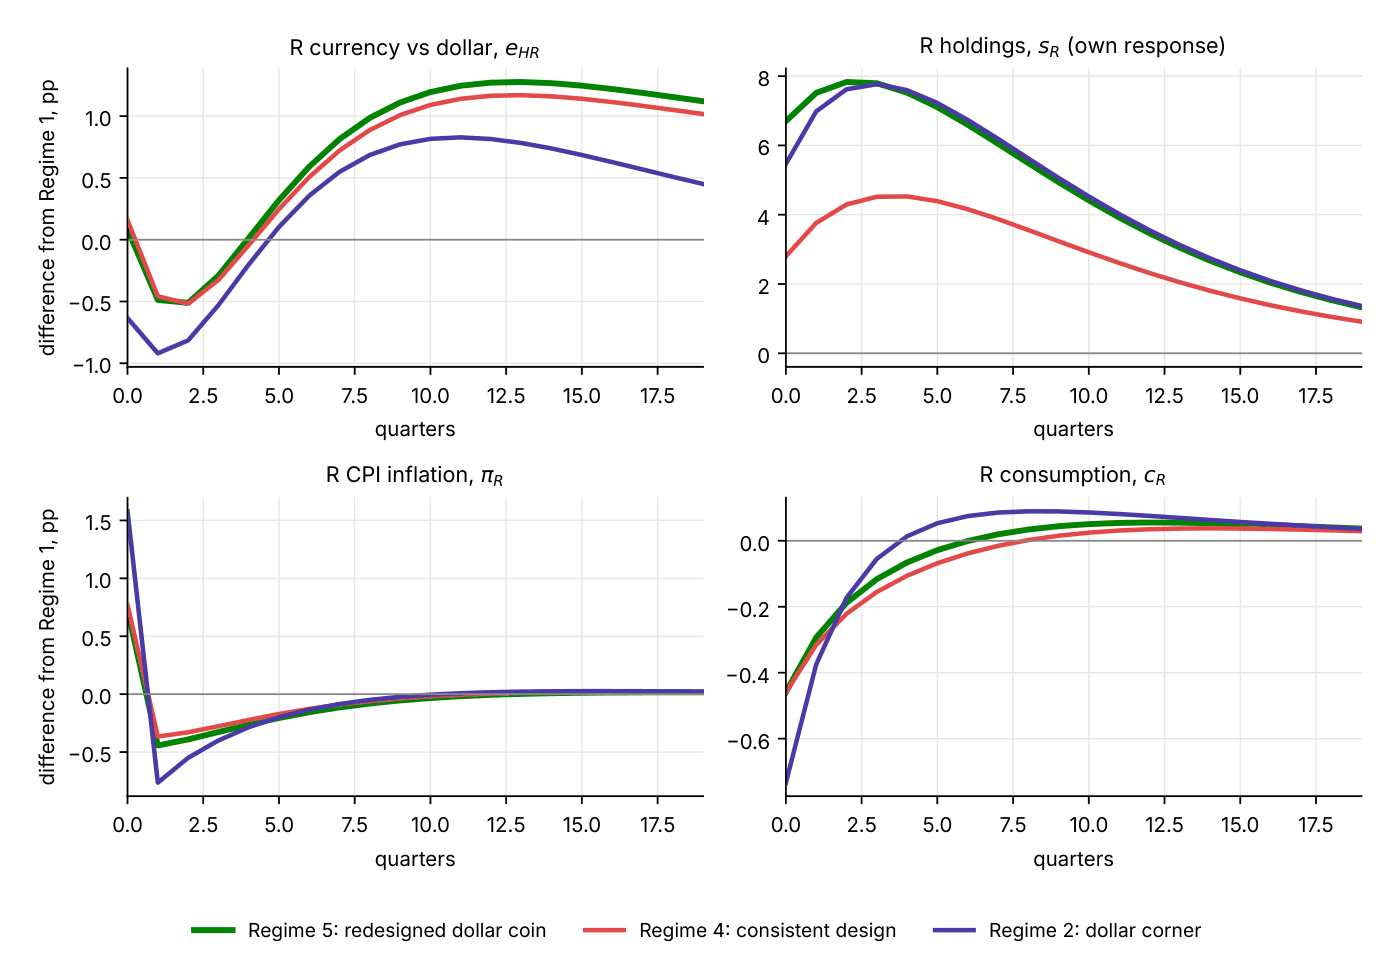
03

Stablecoins, Digital Dollarization, and Triffin Dilemma

Model shows that stablecoin design cannot remove peripheral currency risk but redeploys it; a new Triffin dilemma emerges where the issuer's capital must grow with its open position.

Fanfare 4Crypto & DeFiSilvia SgherriPDF

Time series showing currency value, holdings, inflation, and consumption dynamics across stablecoin regimes.
Figure 3: The redesigned dollar coin (Regime 5)
29

Stablecoins and Creditor Subordination Risk

New U.S. legislation grants stablecoins superpriority in bankruptcy, allowing distressed issuers to subordinate existing creditors and shift losses to depositors before any filing occurs.

Fanfare 2Crypto & DeFiJeffery Y. Zhang and Peter ZimmermanPDF

Portfolio & Allocation2

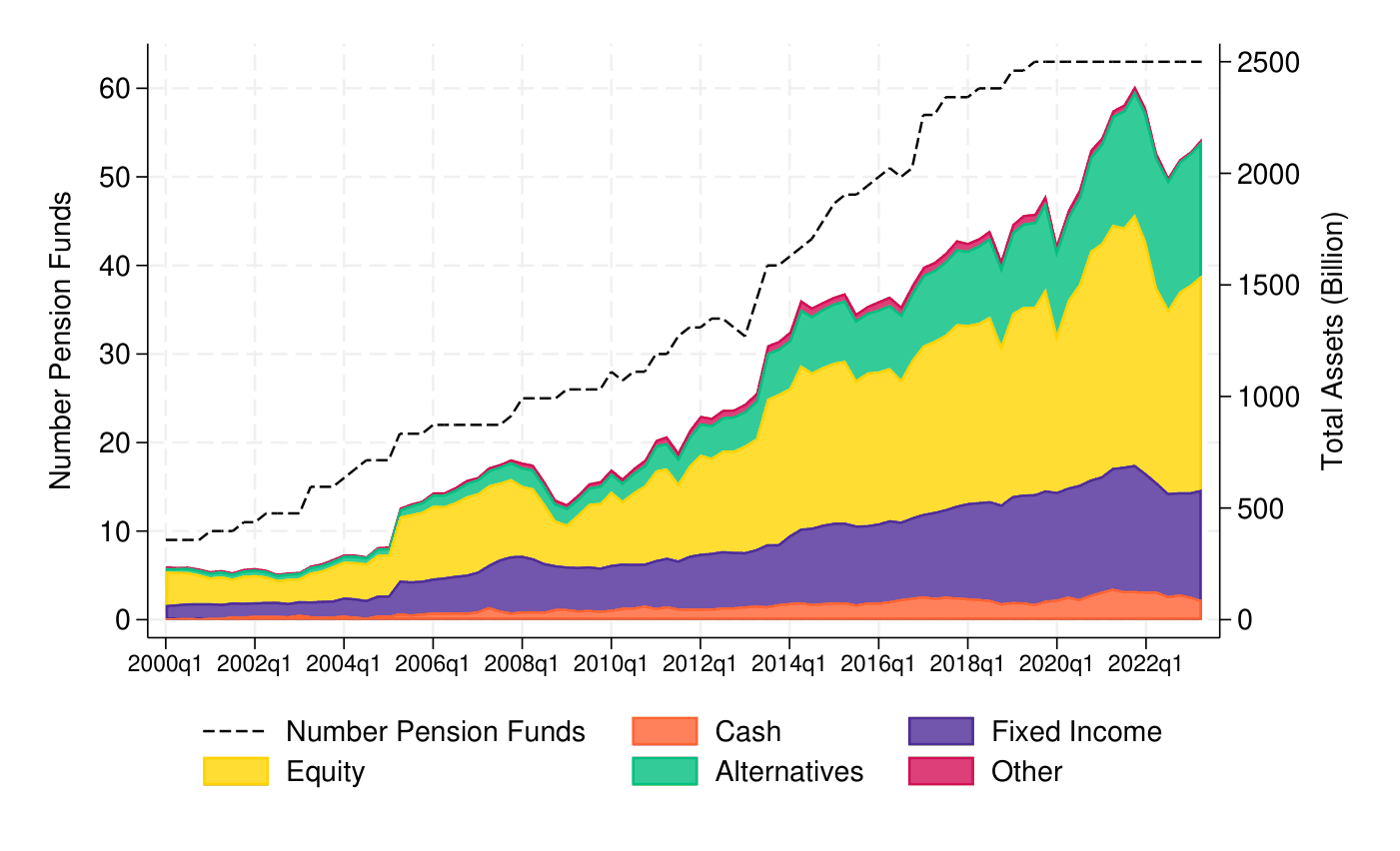
07

Pension Fund Forced Selling in Equities

U.S. pension funds facing negative cash flows sell equities as primary liquidity source rather than rebalancing, absorbing $0.67 per dollar of shock through equity sales.

Fanfare 3Portfolio & AllocationAleksandar Andonov et al.PDF

Asset Allocation from Pension Fund Holdings
Figure 3: Asset Allocation from Pension Fund Holdings
30

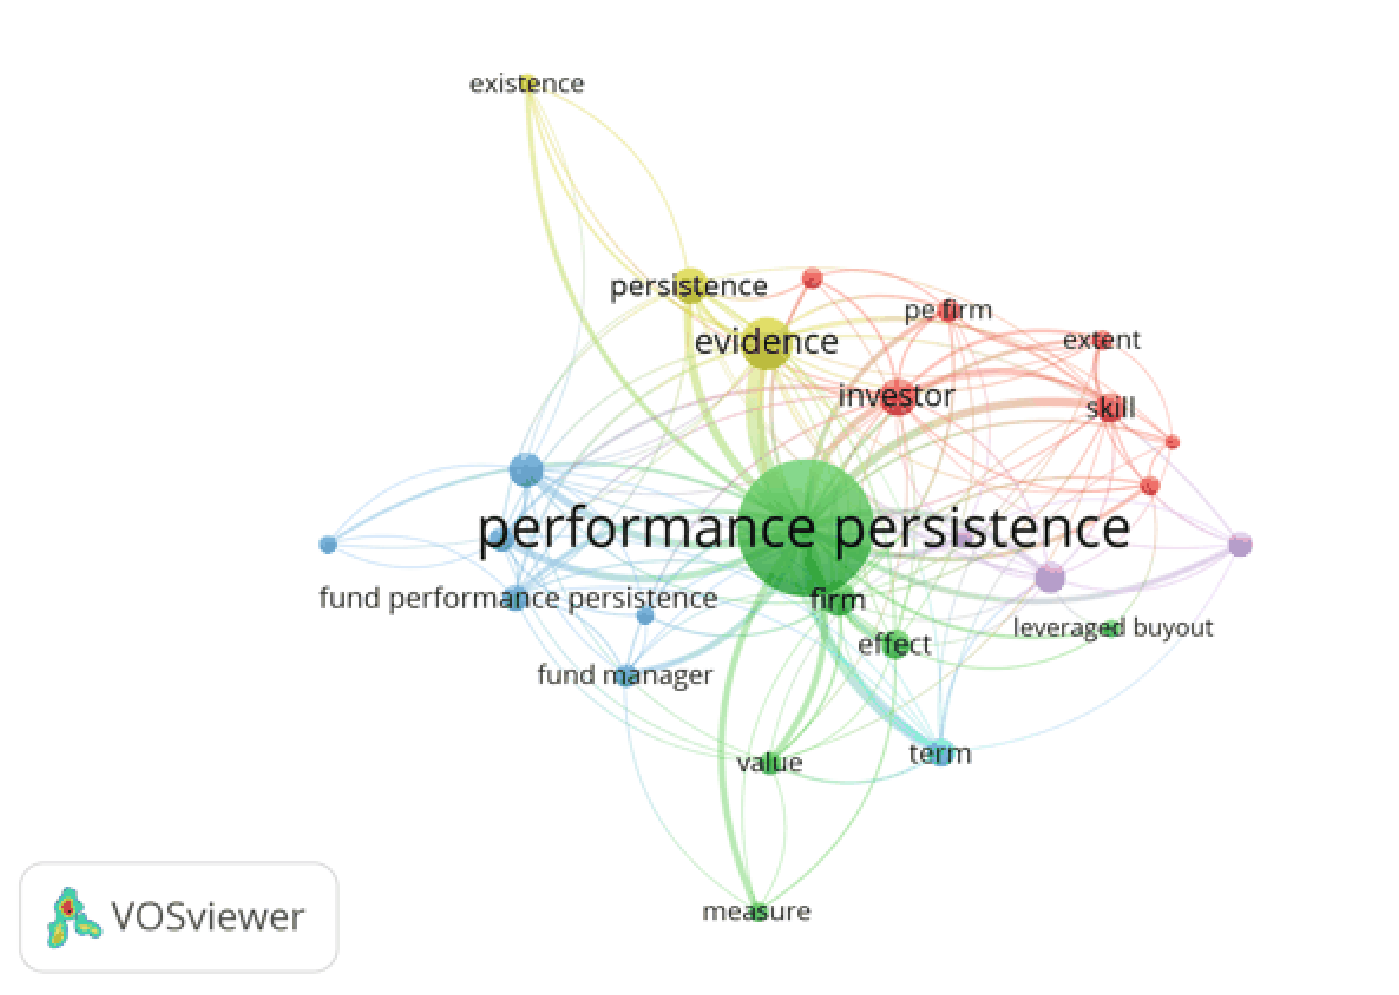
Private Equity Performance Persistence Review

Literature review finds genuine skill in private equity performance persistence, especially in venture capital, but shows estimates often weaken under stricter methods and richer data.

Fanfare 2Portfolio & AllocationOylum Sehvez ErguzelPDF

Network visualization of author keywords co-occurrence
Figure 1: Network visualization of author keywords co-occurrence

Asset Pricing & Factors2

08

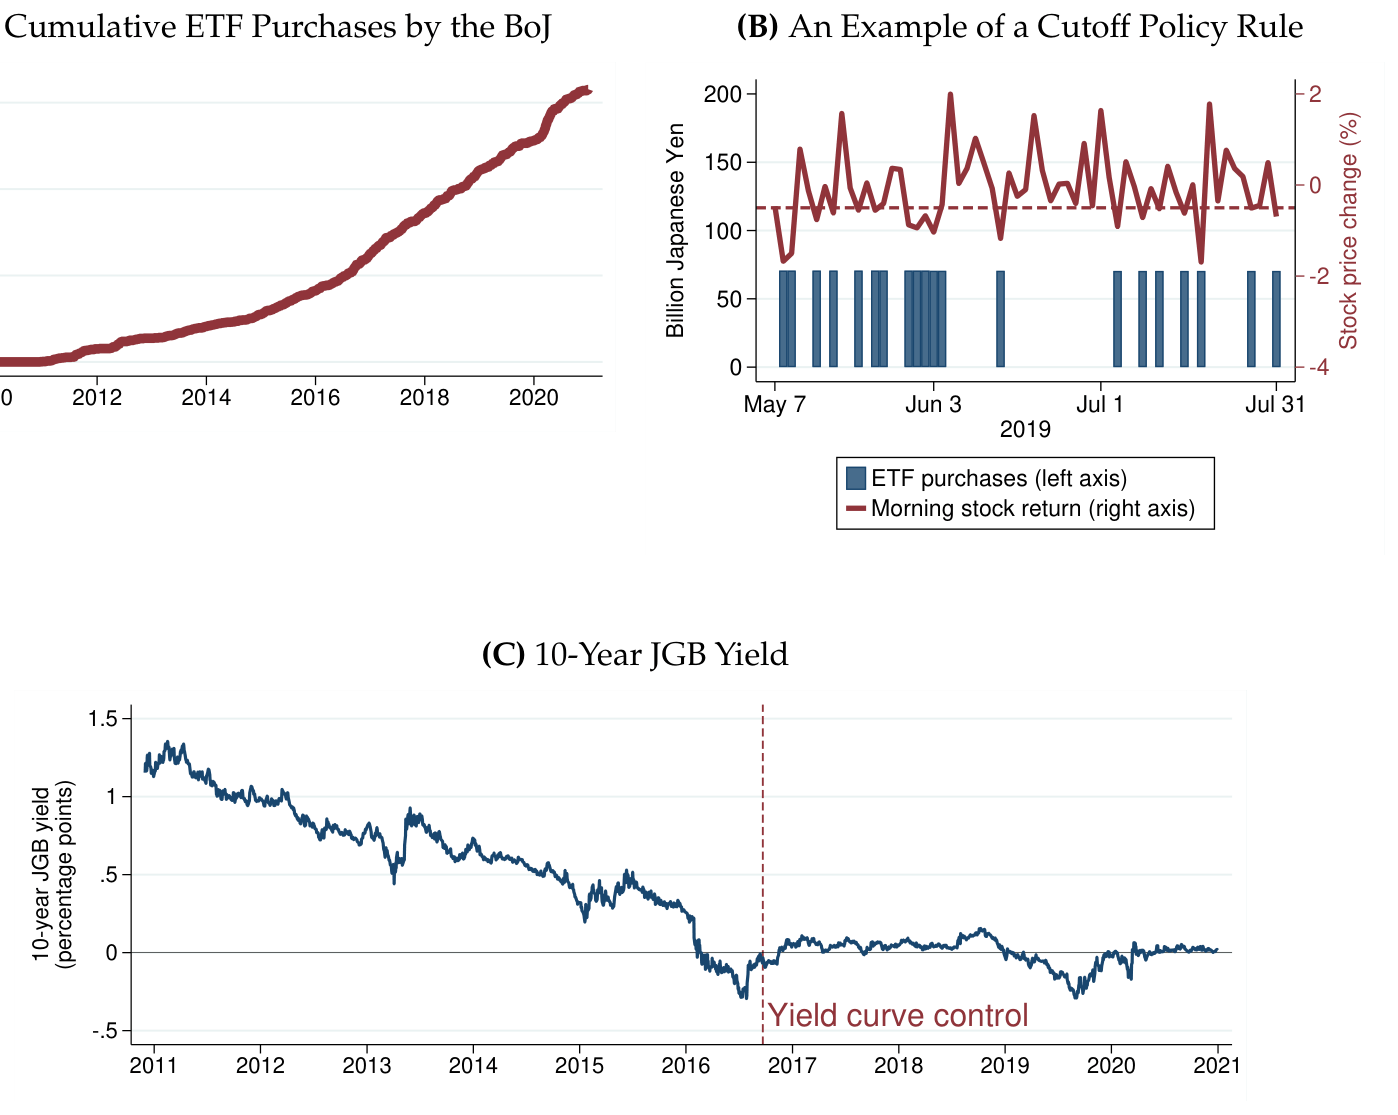
Bank of Japan Stock Purchase Impacts

Using policy-rule discontinuities, the study finds BOJ stock purchases raise long-term rates but lift prices only after yield curve control pegged rates at zero.

Fanfare 3Asset Pricing & FactorsMasao Fukui and Masayuki YagasakiPDF

Unconventional Monetary Policies by the Bank of Japan
Figure 1: Unconventional Monetary Policies by the Bank of Japan
27

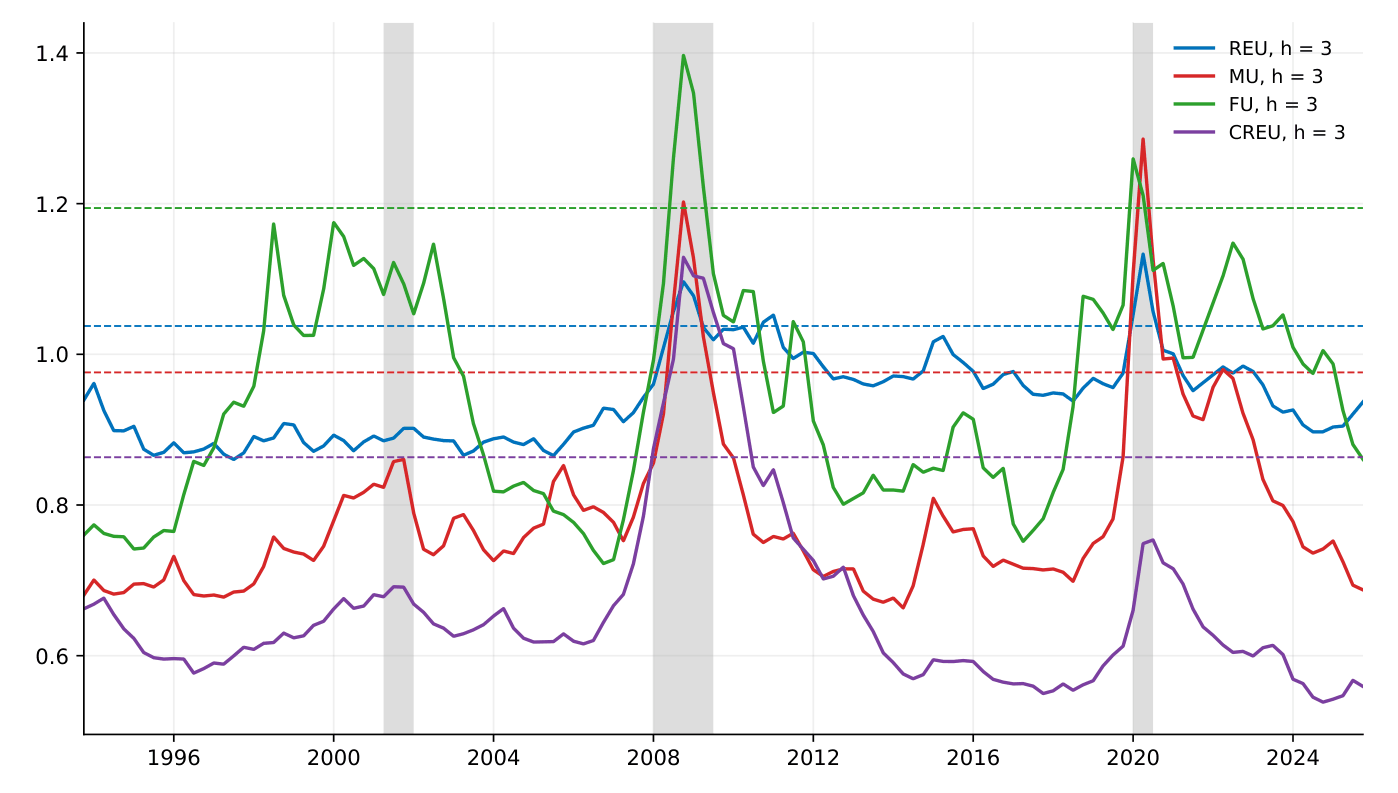
Commercial Real Estate Uncertainty Index

A new uncertainty index for commercial real estate predicts prices and construction spending and accounts for 46 percent of spending forecast errors, outperforming existing uncertainty measures.

Fanfare 2Asset Pricing & FactorsVanessa Dietl and Gabriel LeePDF

Real estate uncertainty indices (REU, CREU, MU, FU) from 1993-2025 at 3-quarter forecast horizon.
Figure 1: REU, CREU, MU, and FU from 1993Q4 to 2025Q4, h = 3

Risk, Credit & Banking5

09

Central Bank Independence and Sovereign Borrowing Costs

Tighter statutory constraints on central bank lending to government reduce real borrowing costs in developing economies while raising debt-to-GDP, with effects strongest where credibility gains matter most.

Fanfare 3Risk, Credit & BankingAngelos Athanasopoulos et al.PDF

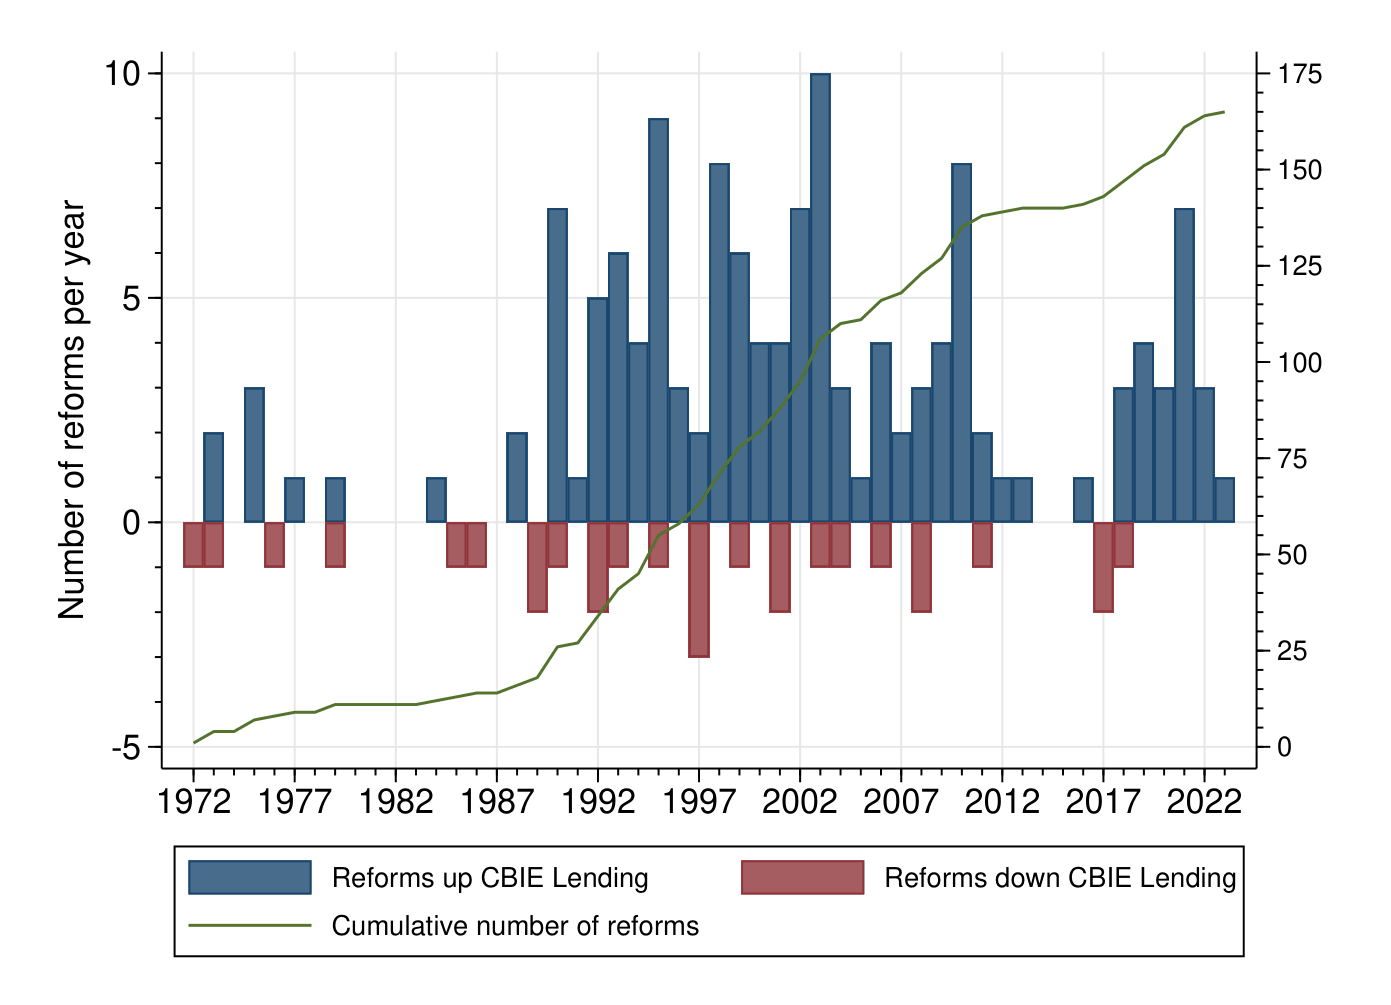
Histogram of central bank lending reforms over time with cumulative reform count trend lines.
Figure 1: Reforms increasing or decreasing the central bank’s lending limits to the govern- ment (1972-2023)
10

Wars and Military Threats in Sovereign Bonds

Analysis of 300,000 monthly bond prices since 1822 shows wars lower external bond returns by five percentage points and raise default risk, while military threats depress threatened states' borrowing costs.

Fanfare 3Risk, Credit & BankingJonathan Federle et al.PDF

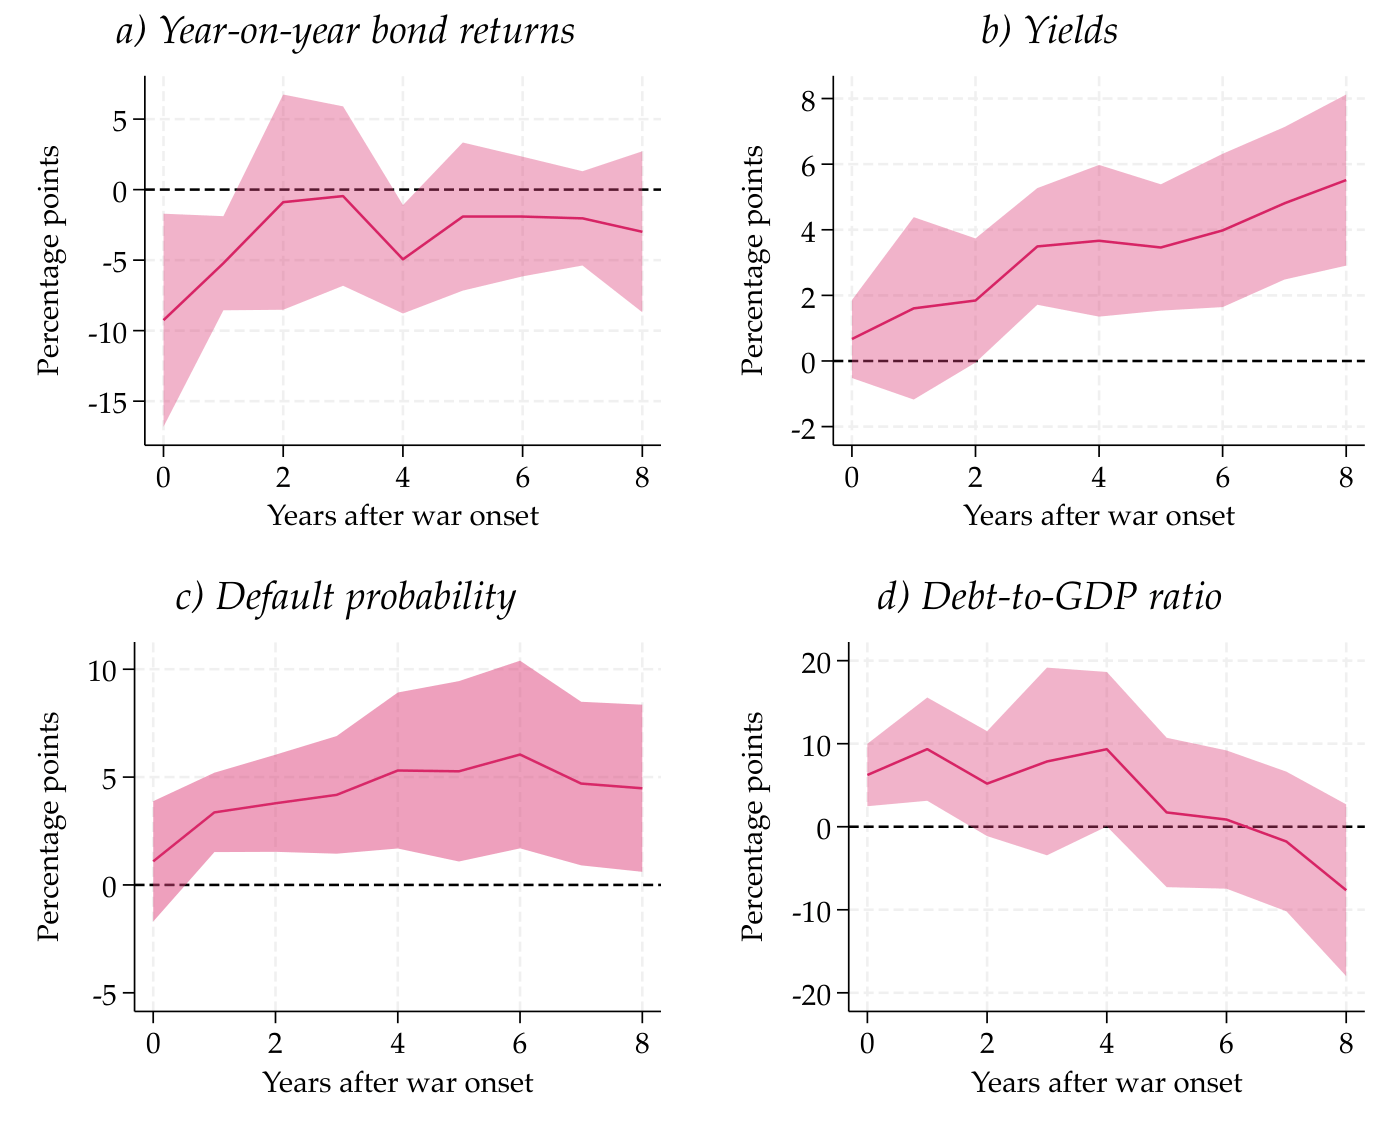
Bond returns decline sharply after war onset, with increased default risk and debt-to-GDP ratio.
Figure 7: Country-level response to 1 SD domestic war shock
15

Sovereign Default Risk and Climate Adaptation

A sovereign default model shows that high borrowing costs and debt overhang depress public adaptation spending, yet adaptation yields the largest welfare gains when financing is tightest near default.

Fanfare 3Risk, Credit & BankingCarlos Bolivar et al.PDF

21

Debt Restructuring and Monetary Policy in EMDEs

Analysis of 17 domestic debt restructurings reveals that monetary transmission often fails to recover post-restructuring due to balance-sheet constraints across sovereigns, central banks, and financial institutions.

Fanfare 2Risk, Credit & BankingUdaibir S. Das and David A. GrigorianPDF

23

Bank Liquidity Regulation and Private Credit Growth

The liquidity coverage ratio significantly boosts private credit growth in counties with more LCR-subject banks, an effect comparable in magnitude to 2012 capital requirement increases.

Fanfare 2Risk, Credit & BankingSebastian Doerr et al.PDF

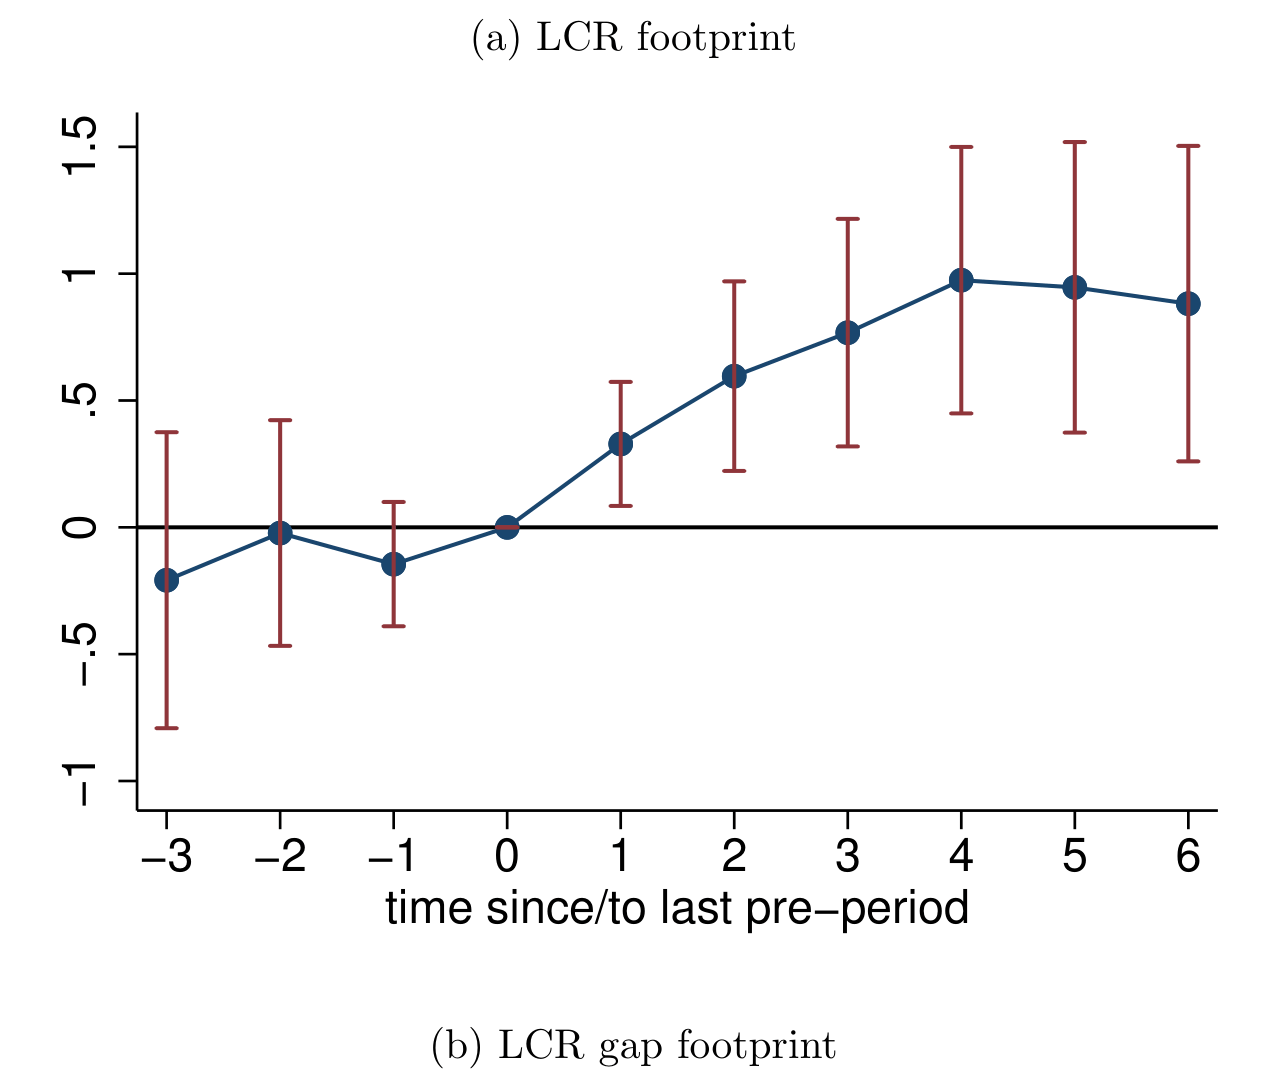
Private credit versus LCR footprint
Figure 3: Private credit versus LCR footprint

Macro-Finance & Rates6

17

Brazilian Monetary Policy Surprises

Analysis of COPOM announcements reveals target and path surprises move the yield curve differently, with nonlinear effects and sign asymmetries in inflation expectation responses.

Fanfare 2Macro-Finance & RatesFrederico Bastone and Mauro Sayar FerreiraPDF

Target and path monetary policy surprises factors across COPOM meetings
Figure 3. Target and path monetary policy surprises factors across COPOM meetings
18

Financial Conditions and Macro Tail Risk

Adding financial conditions to macro forecasts raises recession tail probabilities and lowers growth quantiles, though out-of-sample forecast improvement is inconsistent.

Fanfare 2Macro-Finance & RatesLarissa NawoPDF

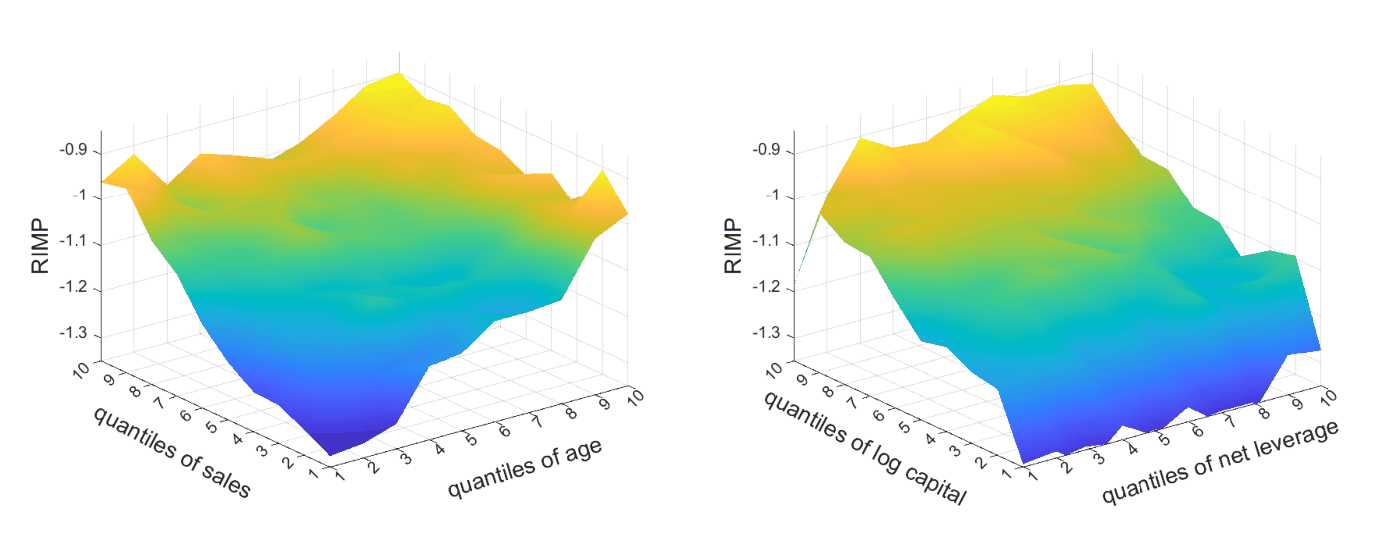
20

Monetary Policy Investment Response Heterogeneity

The study estimates the full distribution of firms' investment responses to monetary policy using clustering regression, finding only 5 percent of firm-time observations show strong sensitivity.

Fanfare 2Macro-Finance & RatesThomas Drechsel et al.PDF

3D surface plots showing monetary policy response heterogeneity across firm characteristics dimensions.
Figure 7: RIMP multidimensionality
24

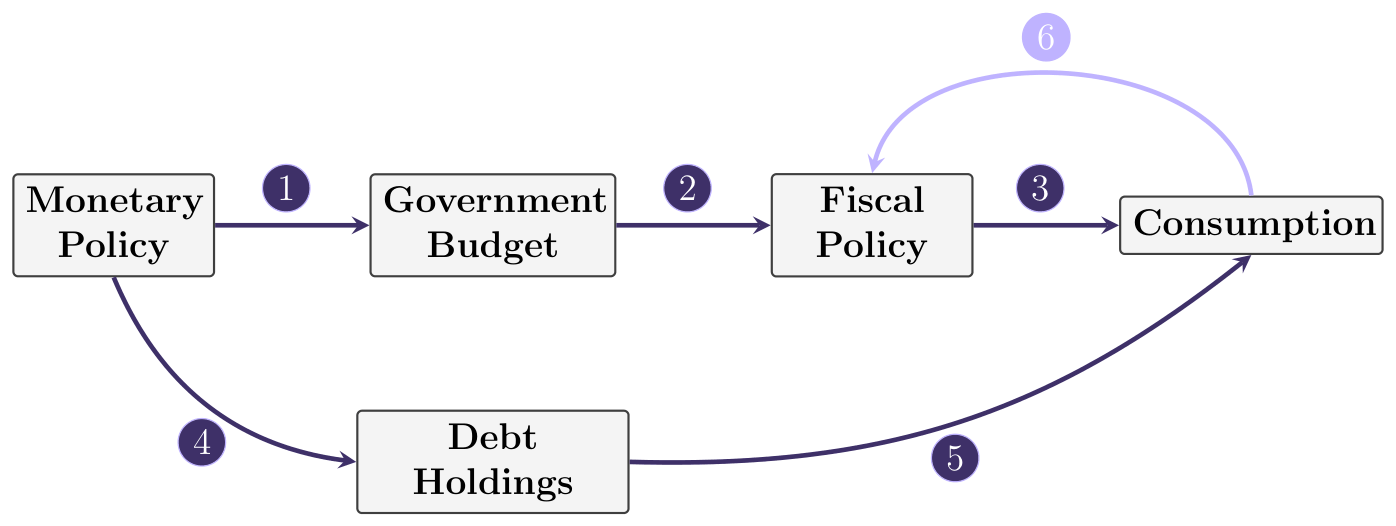
Fiscal Policy Design and Monetary Transmission

Analytical framework shows how debt size, composition, and fiscal rules drive three channels—debt service, debt composition, and fiscal cyclicality—that amplify or dampen monetary policy effects.

Fanfare 2Macro-Finance & RatesS. LavenderPDF

Flow diagram showing monetary policy transmission through government budget, fiscal policy, debt holdings to consumption
Figure 3: Visualisation of the fiscal channels of monetary transmission, with the com- ponents of the debt service channel and the debt composition channel in bold.
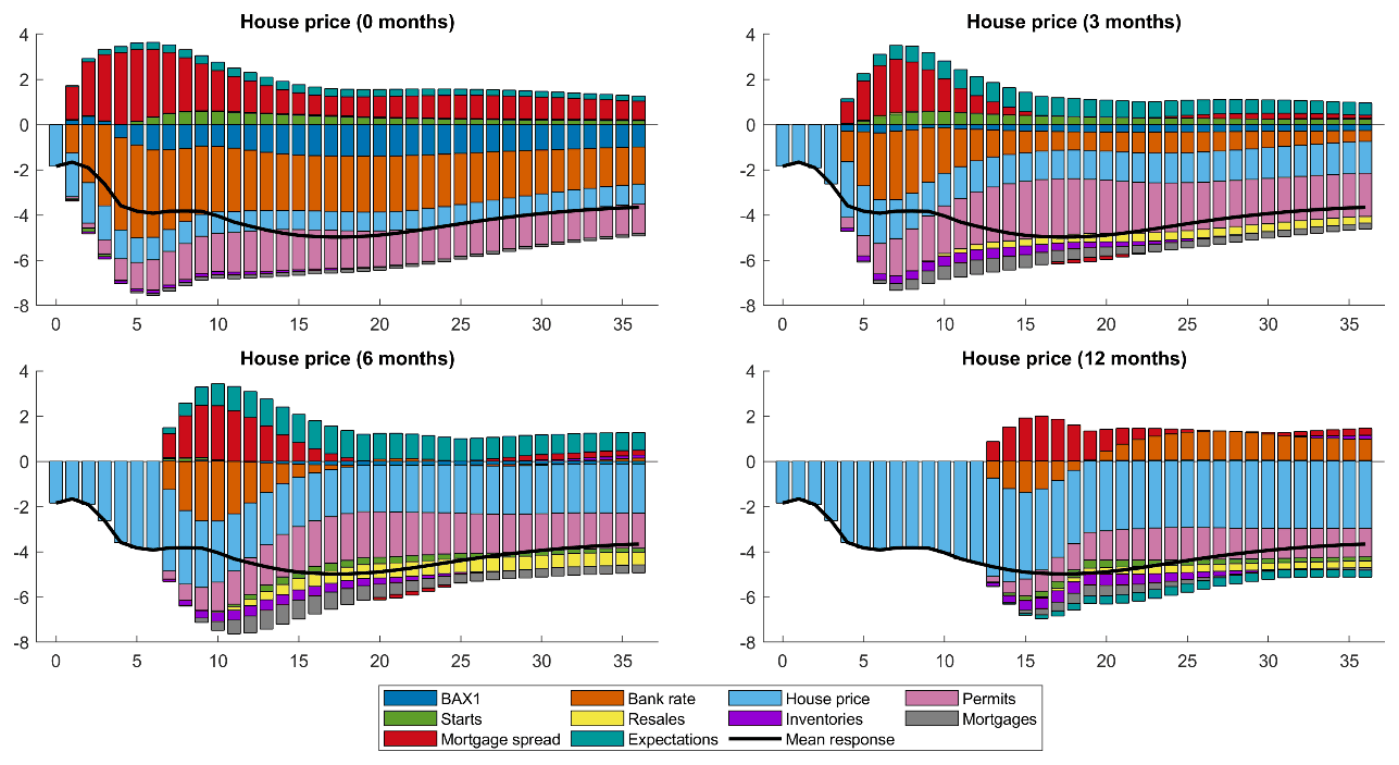
25

Monetary Policy and Housing Supply and Demand

Rate increases substantially reduce house prices and mortgage purchases, with housing starts and permits falling slowly, suggesting demand responds more sharply than supply.

Fanfare 2Macro-Finance & RatesStéphane SurprenantPDF

House price decomposition across multiple horizons showing demand and supply components.
Figure 4: House price decomposition
28

Seasonal Effects in Interest Rate Pass-Through

The research finds that euro-area banks transmit interest rate changes more slowly to lending rates in the fourth quarter during tightening, consistent with year-end volume targets.

Fanfare 2Macro-Finance & RatesZuzana Fungáčová et al.PDF

Also notable1

26

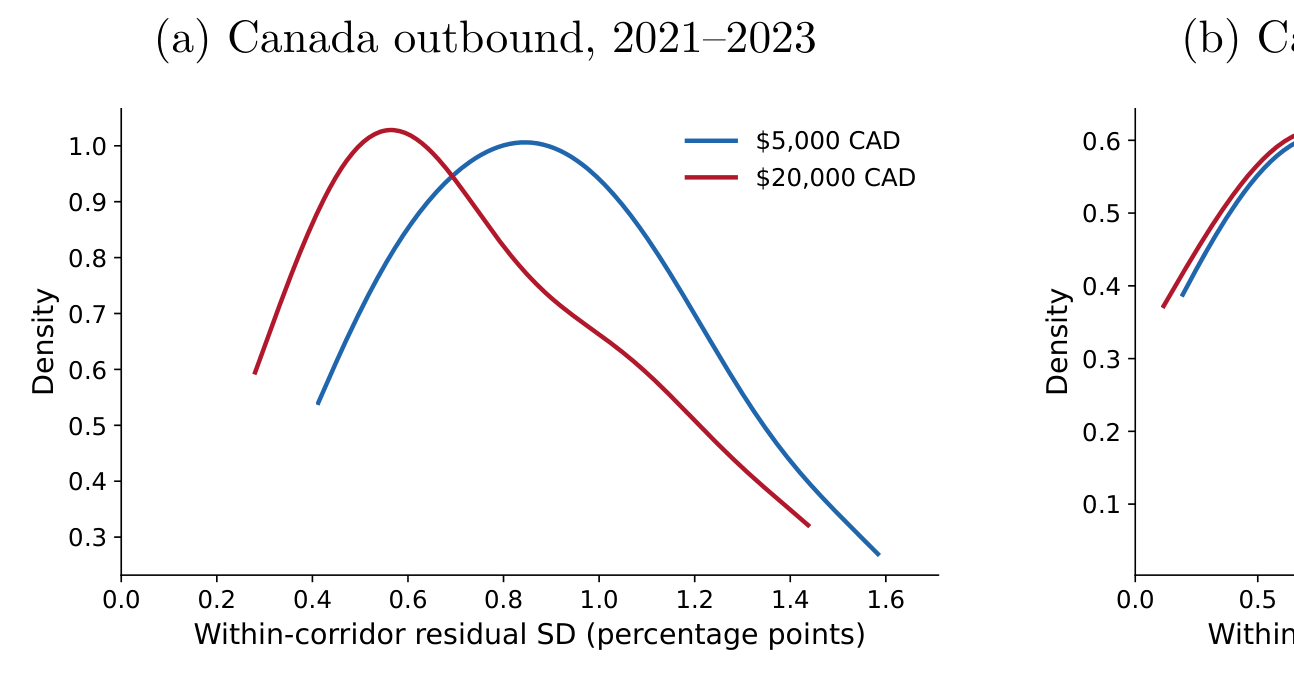
Cross-Border Payment Costs for Firms

Analysis of quoted prices reveals that banks charge firms 2-3.5% for cross-border payments, with foreign exchange margins dominating costs and substantial price dispersion across banks for identical corridors.

Fanfare 2Trading, Microstructure & ExecutionJiaqi LiPDF

Density distributions of pricing dispersion by transfer amount across banks, showing variation by corridor and payment size.
Figure 3: Within-Corridor Pricing Dispersion by Transfer Amount

Read the paperOpen full-size image

    Type to search. Try rough volatility, LLM agents or FinGPT.

    ↑↓ move↵ openesc closeFull search page