Surface-Driven Stochastic Volatility for Commodity Options: Identification of Stochastic Vol-of-Vol and Leverage from Smile Dynamics
Develops a surface-driven stochastic volatility framework for commodity options using daily volatility surface factors, recovering vol-of-vol and leverage parameters from smile dynamics.
Featured in No. 132 on 25 Sep 2026 · 1 day after release · 0 citations today
- Released
- 24 Sep 2026
- First featured
- No. 132 · 25 Sep 2026
- Citations (Semantic Scholar)
- 0
- Influential citations
- 0
- Published in
- Not yet, as far as Semantic Scholar knows
- Fanfare
- 2 of 5
- Identifier
- arXiv:2609.27138
- Authors
- Arthur Steve Tchoneteck et al.
Abstract
From arXiv (CC0).
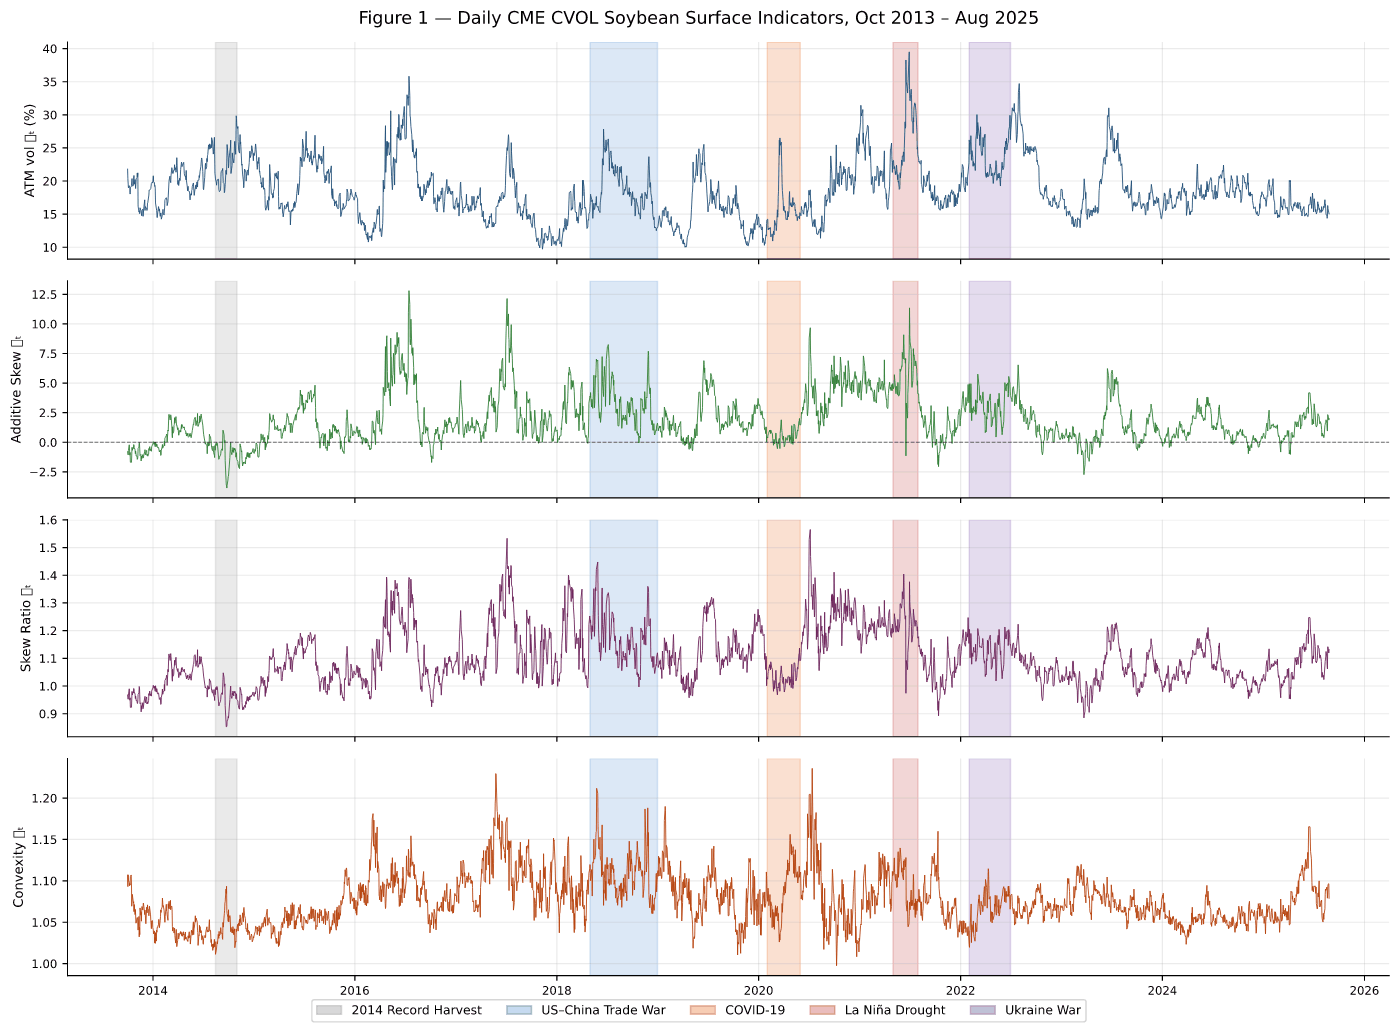
Commodity option surfaces contain information beyond the at-the-money volatility level. We develop a surface-driven stochastic-volatility framework for soybean futures options using daily Chicago Mercantile Exchange Group Volatility Index (CME CVOL) indicators from October 2013 to August 2025. The ATM level and convexity are positive, right-skewed, and well described by log Ornstein Uhlenbeck dynamics, whereas the additive skew changes sign and is modeled on the real line by an Ornstein Uhlenbeck process. These empirical features motivate a joint mean-reverting surface-factor system. Under a log OU futures volatility model, leading-order smile relations map the ATM level to the latent volatility state, convexity to an effective surface-implied volatility- of-volatility state, and skew to an effective leverage state. We derive the associated risk-neutral pricing equation and Feynman Kac representation, benchmark prices by Monte Carlo simulation, validate the pricing PDE by finite differences, and train a neural-network surrogate for fast repeated valuation. The empirical results show substantial variation in surface states across market regimes, with the 2021 La Nina drought window exhibiting elevated volatility and skewness. The numerical results show close agreement between finite-difference and Monte Carlo prices over the validation grid, while the neural-network surrogate reproduces the pricing map at substantially lower inference cost. Overall, the results support the use of level, skew, and convexity jointly as dynamic inputs for commodity-option pricing and model diagnostics.
Citations and venue from Semantic Scholar (ODC-BY), refreshed weekly. Summary: Quant Letter (CC BY 4.0).