Dynamic Spatio-Temporal Graph Attention Networks with Nested Clustered Optimization for Multi-Asset Portfolios
A graph attention network learns time-varying downside risk contagion to guide nested clustered optimization, achieving 5.32% annualized returns and 0.30 excess Sharpe ratio across 13 asset classes.
Featured in No. 140 on 20 Nov 2026 · 3 days after release
- Released
- 17 Nov 2026
- First featured
- No. 140 · 20 Nov 2026
- Published in
- Not yet, as far as Semantic Scholar knows
- Fanfare
- 3 of 5
- Identifier
- arXiv:2611.19903
- Authors
- Supriadi
Abstract
From arXiv (CC0).
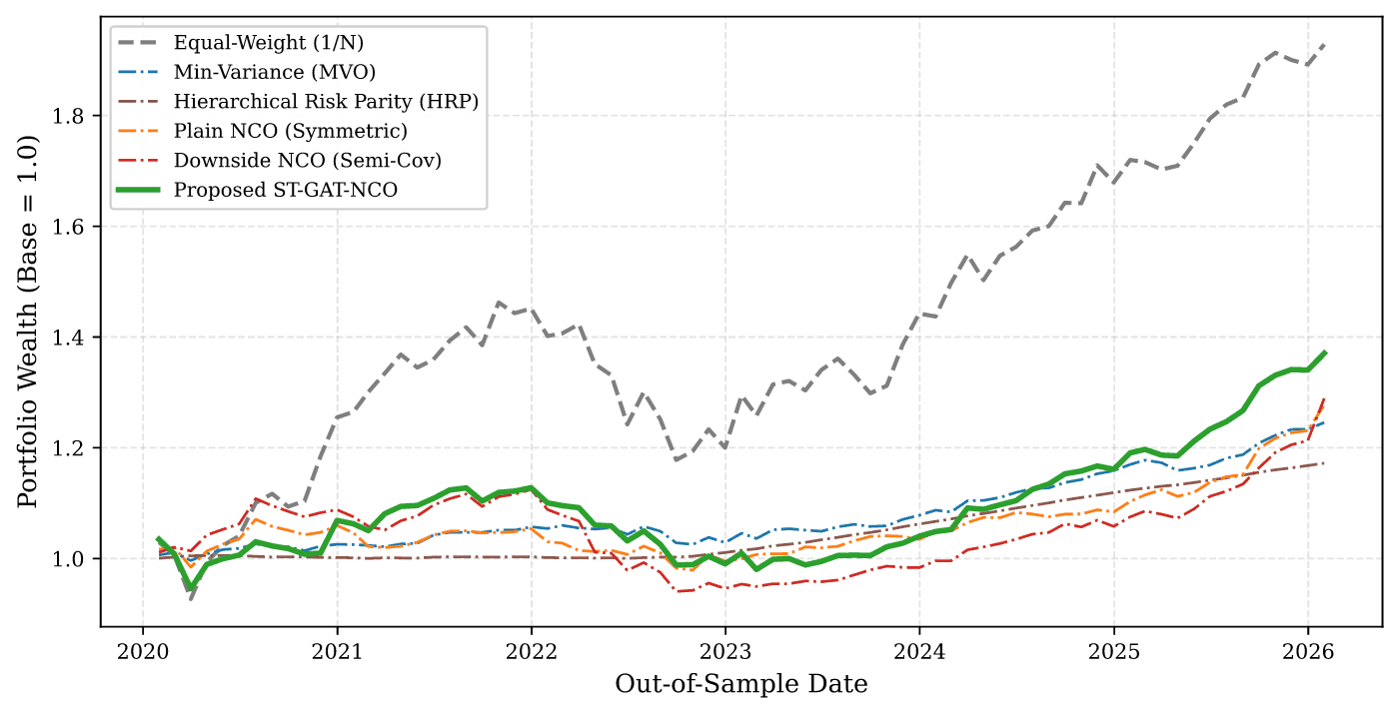
Nested Clustered Optimization (NCO) insulates asset allocation from Markowitz covariance ill-conditioning. However, classical tree clustering relies on static pairwise Pearson correlation, failing to capture time-varying, asymmetric downside risk contagion across multi-asset markets. We propose a unified deep graph machine learning architecture: Dynamic Spatio-Temporal Graph Attention Networks with Nested Clustered Optimization (ST-GAT-NCO) for multi-asset tactical allocation. The framework extracts temporal momentum and downside risk dynamics via causal dilated 1D-convolutions, then deploys a multi-head Graph Attention Network (GAT) over dynamic market topologies to learn latent spatial node representations. These learned embeddings define an angular metric distance space that guides two-stage downside NCO optimization under institutional constraints and turnover smoothing. Evaluated over a 73-month non-anticipative walk-forward out-of-sample window (January 2020 to January 2026) across 13 global asset classes net of 10 bps transaction costs, ST-GAT-NCO achieves a 5.32% CAGR and 37.06% cumulative net return, delivering an excess Sharpe ratio of 0.30 and a Sortino ratio of 0.48. This substantially outperforms classical Minimum Variance (3.68% CAGR, 0.08 Sharpe), Hierarchical Risk Parity (2.65% CAGR), and Plain Symmetric NCO (4.11% CAGR, 0.15 Sharpe), while restricting maximum drawdown to -13.07% (versus -19.44% for Equal-Weight and -16.36% for Downside NCO) under a controlled one-way turnover of 15.31%/month. Regime analysis confirms active capital preservation across the 2020 COVID-19 crash, 2022 monetary tightening, and 2023-2026 disinflation rallies.
Citations and venue from Semantic Scholar (ODC-BY), refreshed weekly. Summary: Quant Letter (CC BY 4.0).