PanelGP: A Probabilistic Factor Model for Asset-Return Panels
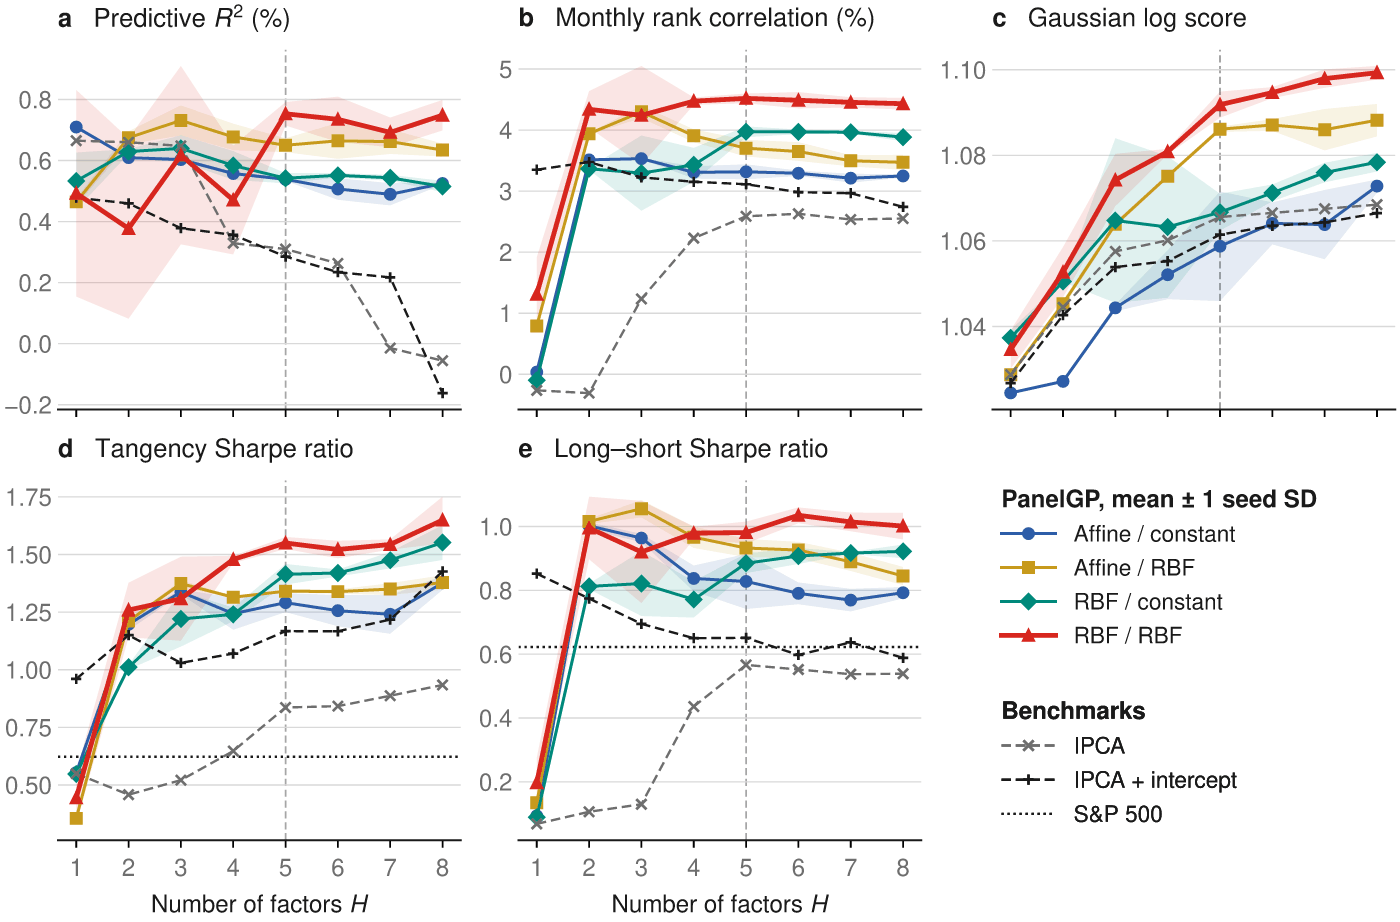
A Gaussian-process factor model with nonlinear loadings estimated from firm characteristics improves stock ranking and portfolio Sharpe ratios over linear alternatives on S&P 500 data.
Featured in No. 138 on 6 Nov 2026 · 2 days after release
- Released
- 4 Nov 2026
- First featured
- No. 138 · 6 Nov 2026
- Published in
- Not yet, as far as Semantic Scholar knows
- Fanfare
- 3 of 5
- Identifier
- arXiv:2611.04040
- Authors
- Andrea Ruglioni and Damir Filipovic
Abstract
From arXiv (CC0).
We develop PanelGP, a conditional factor model for large panels of stock returns in which firm characteristics determine the factor loadings and economic conditions determine the expected factors. Both relations are estimated nonparametrically with Gaussian-process priors. The kernel choice nests instrumented principal component analysis (IPCA) as well as smooth nonlinear maps. Asset-specific loading innovations and common factor innovations separate idiosyncratic from systematic risk, so one estimated model forecasts both expected returns and their covariance matrix. Estimation uses sparse variational inference with a joint posterior over loadings and factors. Because each predicted return is bilinear in a Gaussian state, the predictive covariance matrix and the cumulants of any portfolio have closed forms. In simulations, the estimator recovers the nonlinear maps and the variance parameters. For S&P 500 constituents over 1995-2024, nonlinear loadings rank stocks better than affine loadings and improve the Gaussian log score. Relative to IPCA, the resulting portfolios have higher Sharpe ratios, also net of trading costs, and the minimum-variance portfolio has lower volatility. The predicted variances rank stocks and months by risk but are too compressed.
Citations and venue from Semantic Scholar (ODC-BY), refreshed weekly. Summary: Quant Letter (CC BY 4.0).