ML-QuantSubscribe

Quant Letter

October 2026, Week 4

The week in quantitative finance research: 90 papers from arXiv, SSRN and RePEc, screened and ranked, 17–23 Oct 2026.

Papers
90
New this week
89
With figures
50
High fanfare
8

From the editor

This week spans AI risk in trading, neural microstructure learning, and the frontier's limits. Key tensions emerge: LLM traders fall to information attacks while benchmarks show no leading model beats equal-weight; neural filters cut arbitrage uncertainty eightfold yet ML VaR models hide regime-shift failures. Mean-field DEX liquidity and arbitrage-free IV surfaces advance pricing theory. See Information Injection Attacks, State-Space Models Learn Market Structure, and ML Value-at-Risk Validation Under Regime Shifts.

Top picks

If you read five papers this week, read these.

  1. Information Injection Attacks on LLM Traders

    Fabricated news reaches 62% attack success against LLM trading agents, far exceeding prompt injection, with surface-form credibility cues mattering more than content accuracy.

    Fanfare 4ML & AI Methods
    Information injection threat model
  2. The study shows that machine-learning VaR models passing standard backtests breach risk limits two to nine times worse in stressed regimes, revealing false comfort in current regulatory validation.

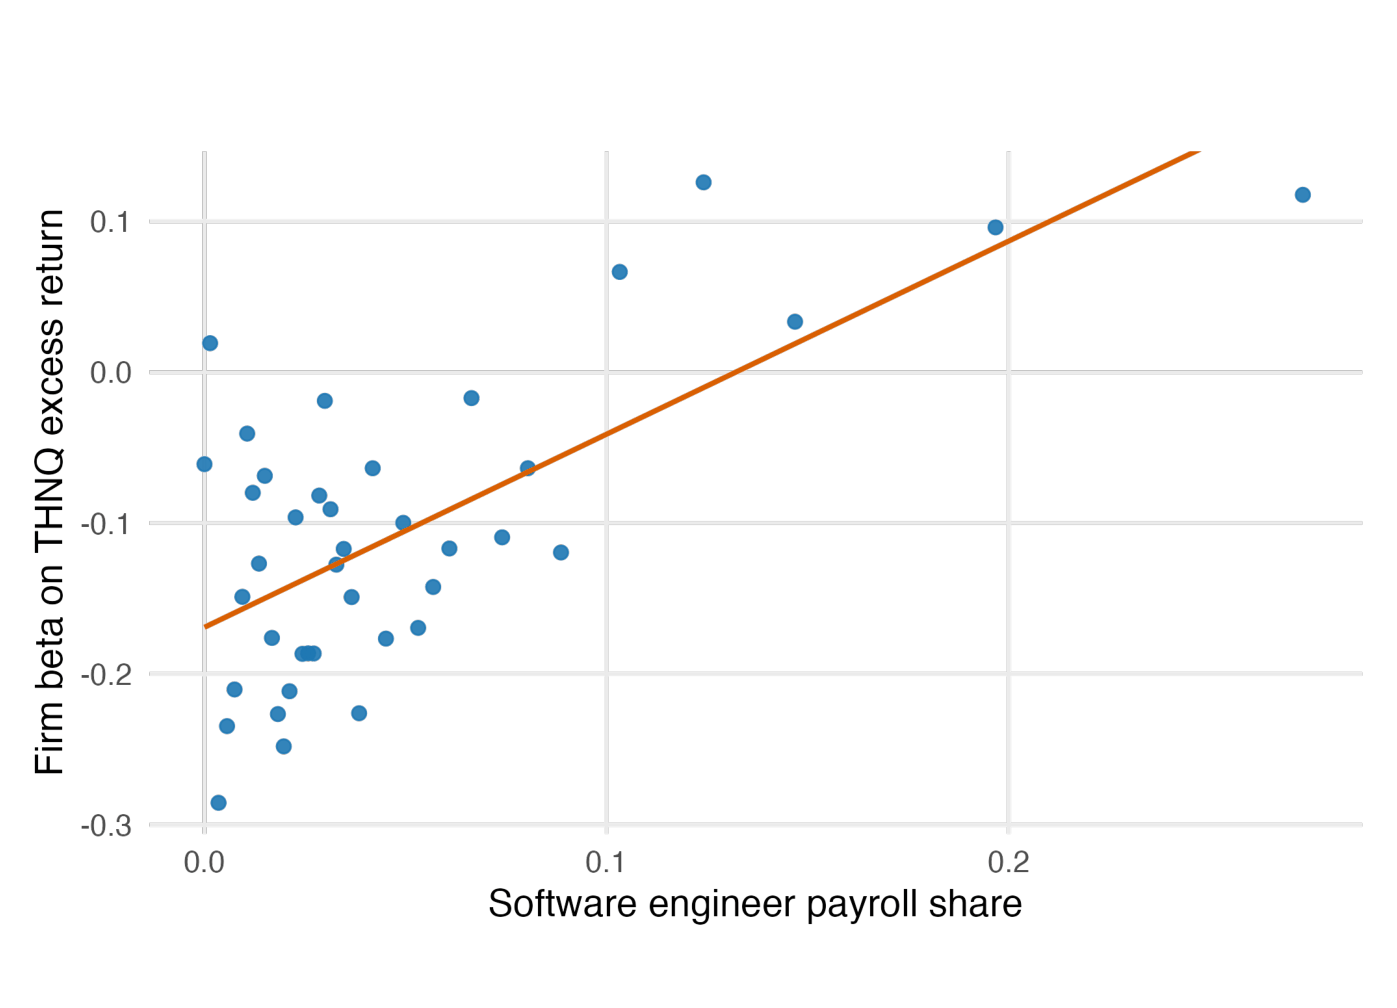
  3. Software engineering payroll share vs
  4. Using 3.8 billion option contracts, the study finds implied kurtosis predicts five-day returns with 2.33 Sharpe ratio and improves volatility forecasting by 23.3 percent.

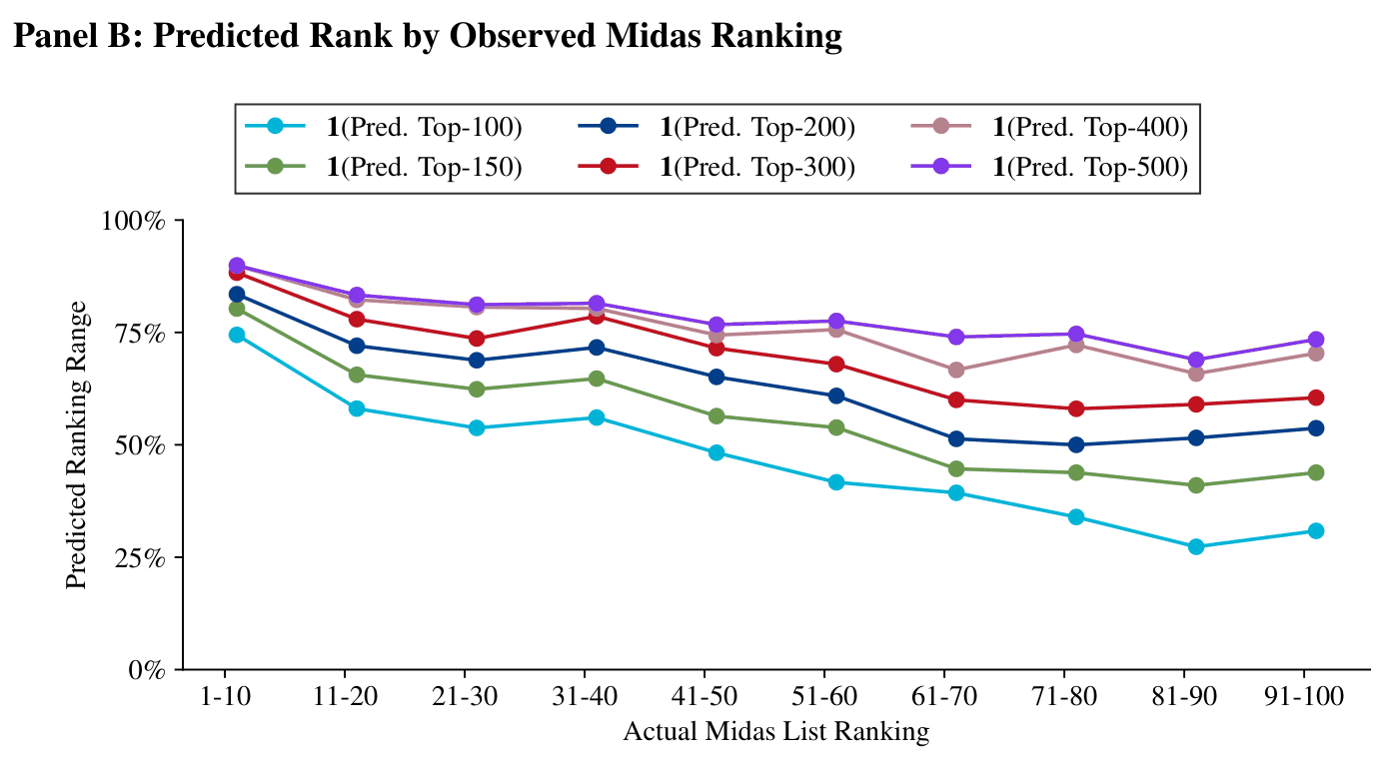
  5. Panel A displays the likelihood for whether a VC professional is included on the Midas list in a given year based on

What's rising

Topics drawing unusually many papers this week.

  1. Market making

    1.8×

    2.3% of this week's 696 new papers, 1.8x its share over the previous 4 weeks (1.3%).

  2. Prediction markets

    1.8×

    2.4% of this week's 696 new papers, 1.8x its share over the previous 4 weeks (1.4%).

  3. DeFi

    1.8×

    2.0% of this week's 696 new papers, 1.8x its share over the previous 4 weeks (1.1%).

GitHub radar

What the quant community starred on GitHub this week, from a panel of 10,589 developers who follow financial machine learning (285 of the 859 we checked starred something). Counts only: we never publish who starred what.

Quant repos rising

  1. Open-source market platform tracking real-time stock prices and alerts.

    ★ 20.8k+511 this weekTypeScript

  2. Foundation model for the language of financial markets.

    ★ 43.4k+2,562 this weekPython

  3. Research workbench for China A-shares, US and HK stocks.

    ★ 2,782+63 this weekTypeScript

  4. Swarm intelligence engine for financial forecasting and predictions.

    ★ 81.4k+1,689 this weekPython

What quants are playing with

  1. Unknown tool with no description provided.

    ★ 18.3k+17.6k this weekPythonNew repo

  2. High-performance large-scale inference framework for DeepSeek models.

    ★ 20.6k+20.6k this weekPythonNew repo

  3. morluto/rea15 quants

    Reverse engineer anything with agents from app behavior to binaries.

    ★ 370k+76.1k this weekTypeScript

  4. Ephemeral workspaces with durable shared history and parallel agent support.

    ★ 1,978+1,529 this weekRustNew repo

  5. Local-first search engine and MCP server for AI agent memory.

    ★ 13.3k+6,242 this weekRust

  6. Unknown tool with no description provided.

    ★ 7,258+2,250 this weekJavaScript

  1. Now publishedShort Communication: Exponential Utility Maximization in a Discrete Time Gaussian Framework

    Now published in SIAM J. Financial Math. · featured 1 Jun 2023, 3 days after release; 4 citations

  2. Now publishedShort Communication: On the Separability of Vector-Valued Risk Measures

    Now published in SIAM J. Financial Math. · featured 31 Jul 2024, 8 days after release; 4 citations

  3. Now publishedShort Communication: The Price of Information

    Now published in SIAM J. Financial Math. · featured 21 Feb 2024, 2 days after release; 3 citations

All papers

Filter by venue, topic or fanfare.

Venue
Topic
Fanfare
90 papers

arXiv

Quantitative finance and ML-for-finance preprints

30 papers · 28 figures

ML & AI Methods4

01

Information Injection Attacks on LLM Traders

Fabricated news reaches 62% attack success against LLM trading agents, far exceeding prompt injection, with surface-form credibility cues mattering more than content accuracy.

Fanfare 4ML & AI MethodsMengxiao Wang and Nitesh SaxenaPDF
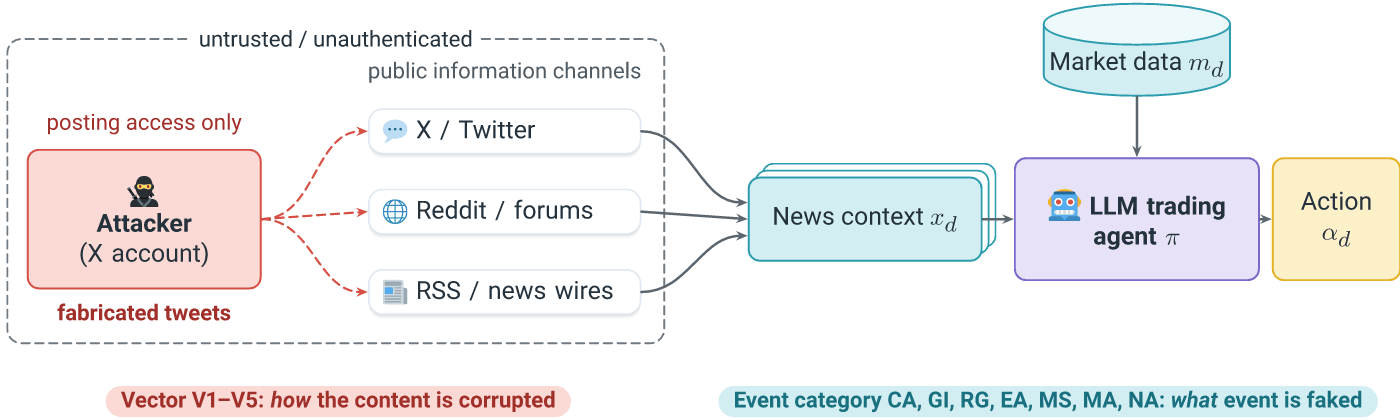
Information injection threat model
Figure 1 : Information injection threat model. The attacker holds only a posting position on public information channels (e.g., X, Reddit, RSS). The agent’s news pipelin…
03

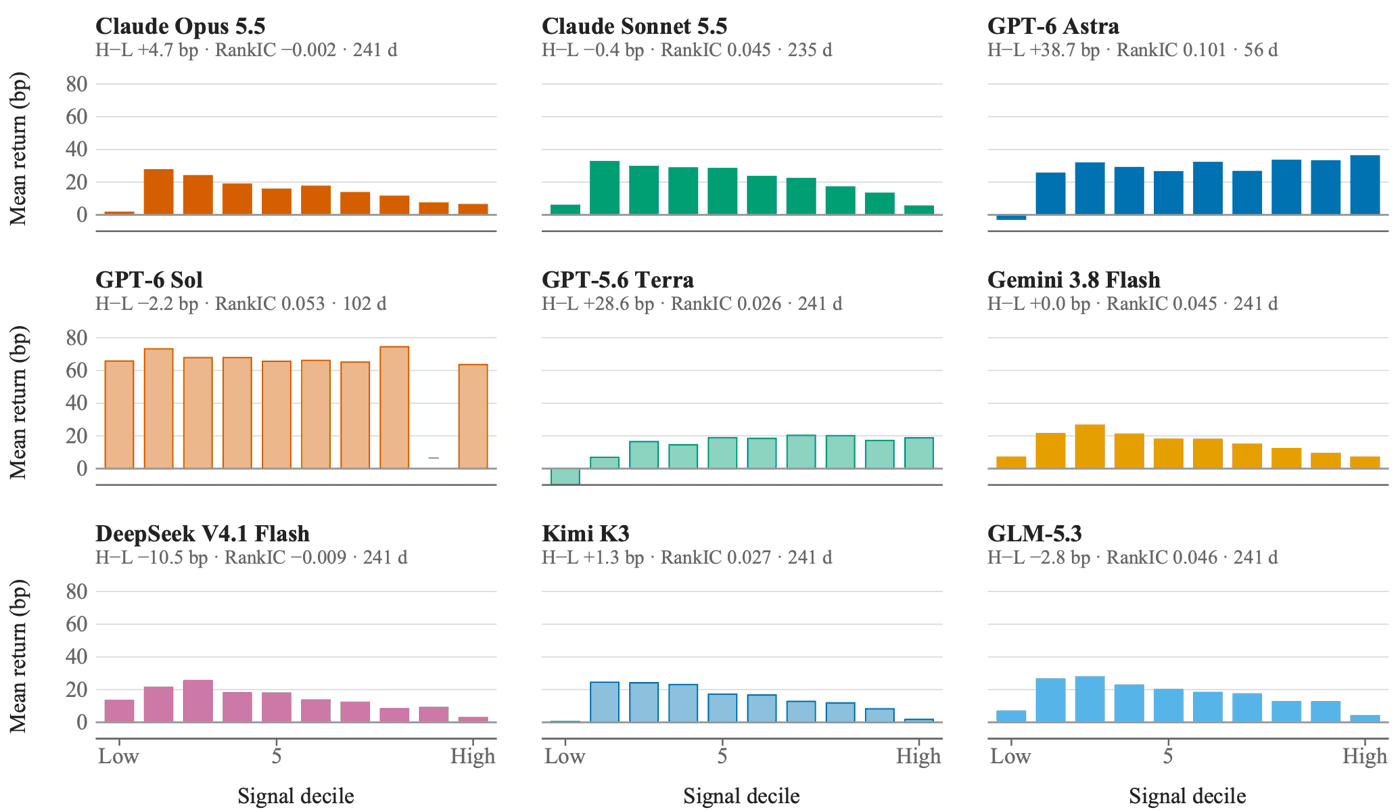
Quant-Arena: LLM Strategy Benchmark

A public benchmark tests whether large language models can complete end-to-end quantitative research with real trading constraints; no frontier model beats the equal-weight market in 2024.

Fanfare 3ML & AI MethodsHoude Qian et al.PDF
Mean next-day return by daily score decile for the nine models’ best iterative configurations in 2024, in basis points
Figure 3 : Mean next-day return by daily score decile for the nine models’ best iterative configurations in 2024, in basis points (bp). H–L is the highest-minus-lowest d…
26

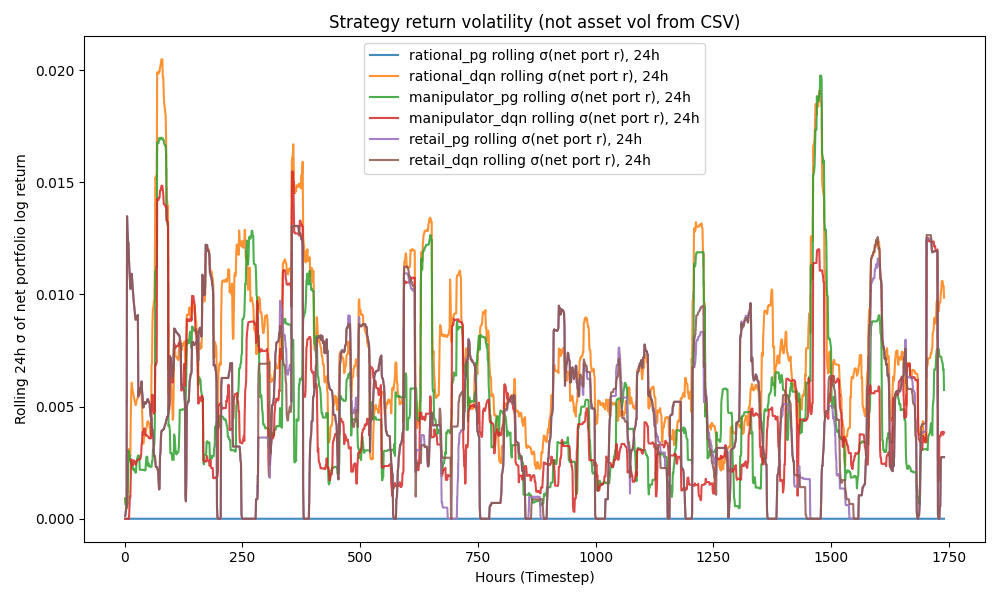
Agentic AI Behavior and Automated Market Stress

Deep reinforcement learning simulates three agent archetypes in automated markets, finding herd-followers generate frequent short stress episodes while manipulators create persistent volatility.

Fanfare 2ML & AI MethodsIrene Aldridge et al.PDF
Rolling volatility comparison across five agent types over time, showing distinct stress patterns.
Figure 3 : Rolling 24-hour standard deviation of net strategy log returns, by agent.
27

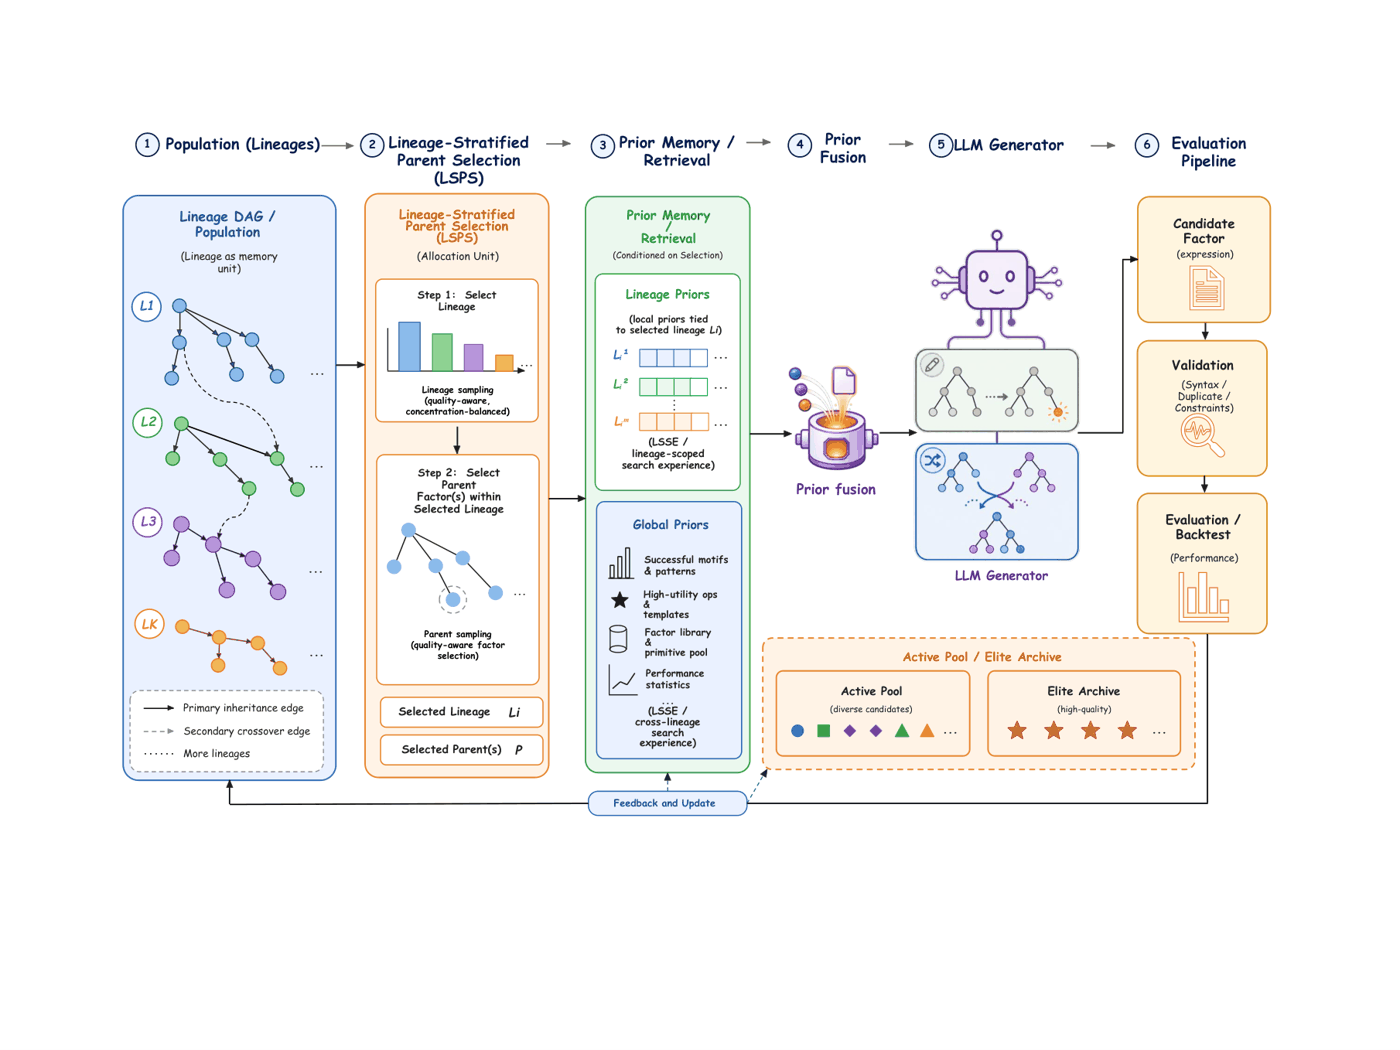
Lineage-Aware Search in LLM-Based Factor Mining

LineageEvo guides large-language-model-based alpha factor search using lineage-conditioned variation and stratified allocation, promoting diverse and predictive factor discovery.

Fanfare 2ML & AI MethodsXintong Liu et al.PDF
LineageEvo system overview showing pipeline from lineage selection through factor generation and validation.
Figure 1: Overview of LineageEvo . LSPS first selects a lineage and then selects parent factor(s); lineage-specific and global operator priors are subsequently retrieved…

Trading, Microstructure & Execution10

02

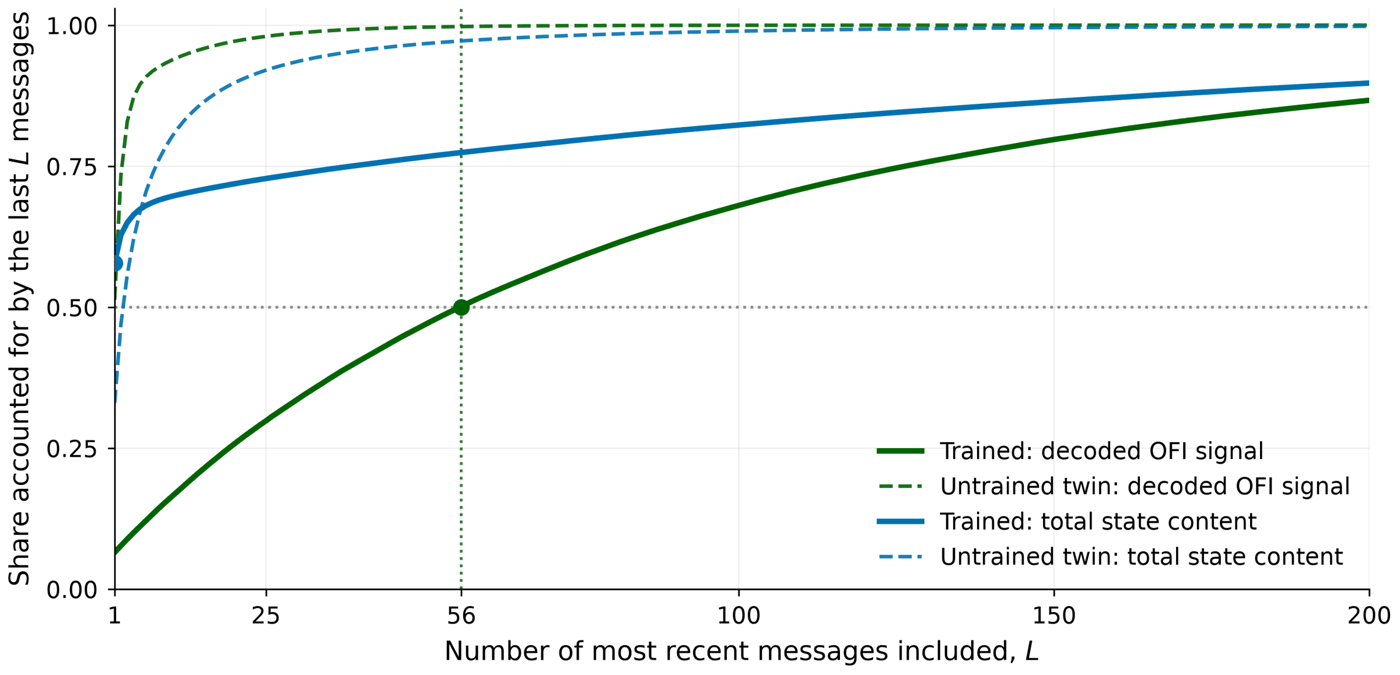
State-Space Models Learn Market Structure

A Mamba sequence model trained on limit-order-book messages learns order-flow imbalance as an internal representation with R² ≈ 0.59 and generalizes across stocks and microstructure metrics.

Fanfare 3Trading, Microstructure & ExecutionValentin Mohl et al.PDF

Learning curves showing order-flow imbalance signal captured by state-space model versus random baseline
Figure 4. Share of the recurrent state (blue; all layers) and of the decoded OFI signal (green; best layer) accounted for by the L most recent messages, for the trained…
04

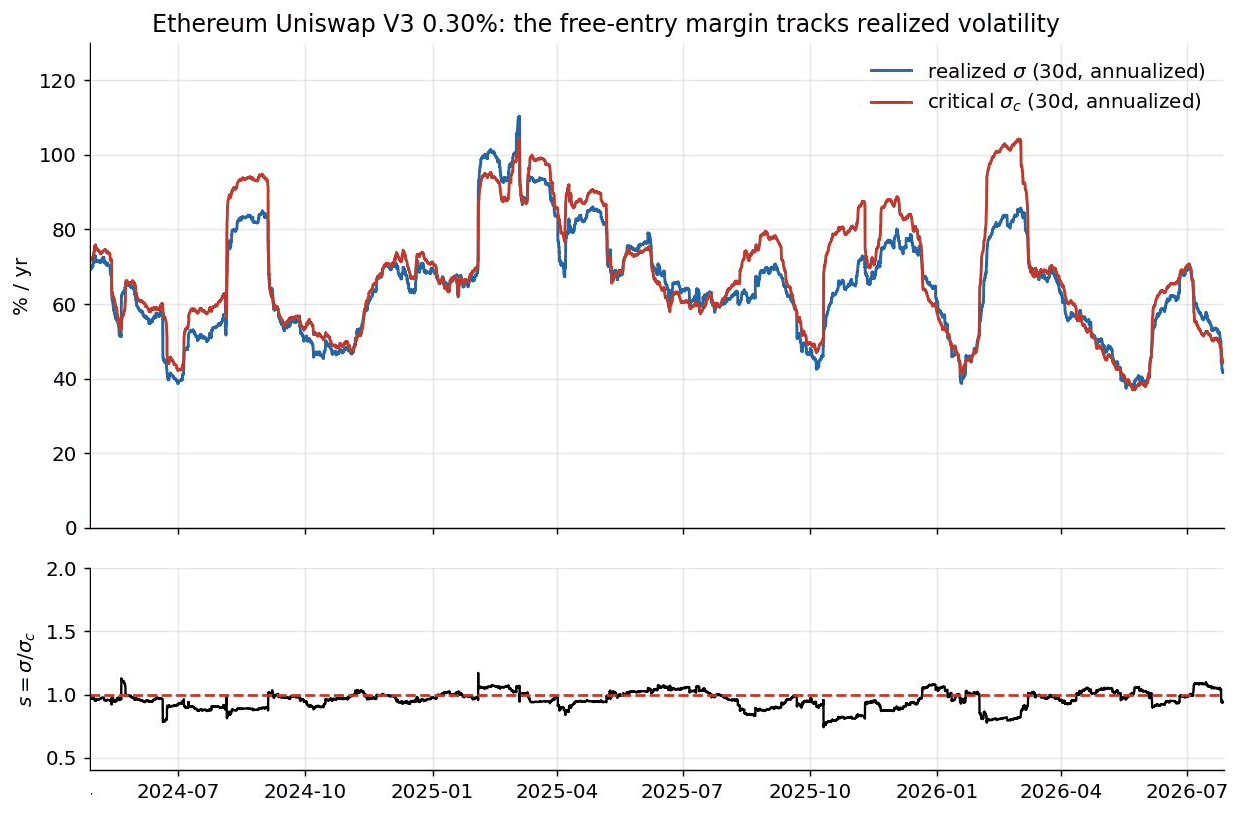
Mean-Field Game of Liquidity Provision on DEXs

The research models liquidity provision on decentralized exchanges as a mean-field game and derives closed-form solutions linking critical volatility to market microstructure parameters, validated on Ethereum data.

Fanfare 3Trading, Microstructure & ExecutionMikhail Belokon and Rostislav BerezovskiyPDF

Realized volatility versus critical volatility and participation margin ratio over time for Ethereum Uniswap V3.
Figure 1: Ethereum Uniswap V3 0.3\% . The top panel shows the 30 -day annualized realized \sigma and the critical \sigma_{c} of ( 34 ), neither fitted to the other, and…
07

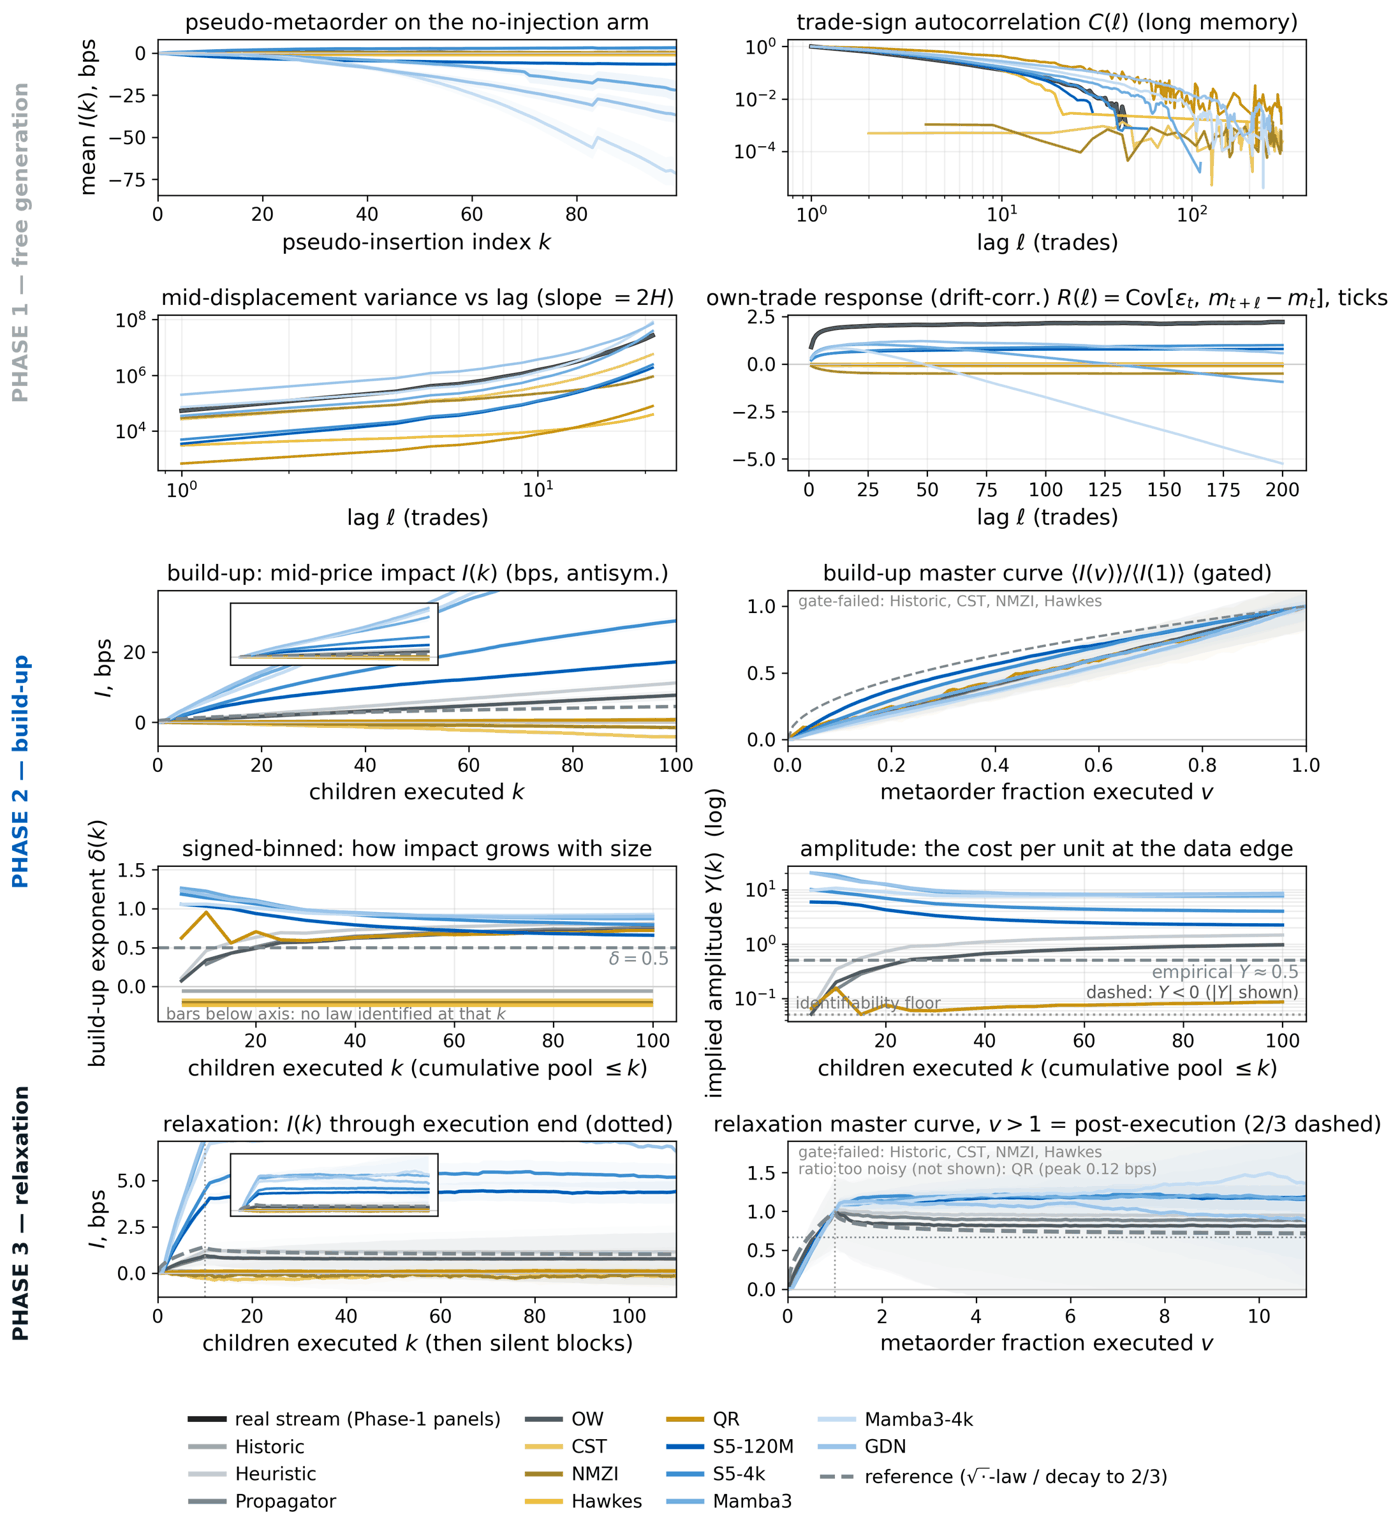
Market Impact in Generative Limit Order Book Models

Injecting metaorders into neural limit-order-book generators reveals that market impact emerges naturally from next-token prediction, enabling benchmarking of realistic simulator behavior.

Fanfare 3Trading, Microstructure & ExecutionGeorge Nigmatulin et al.PDF

The AMD measurements, all three phases in one figure ( 5{\times}2 )
Figure 4. The AMD measurements, all three phases in one figure ( 5{\times}2 ). Top, Phase 1 : pseudo-metaorders on the no-injection arm (the pipeline returns drift, not…
11

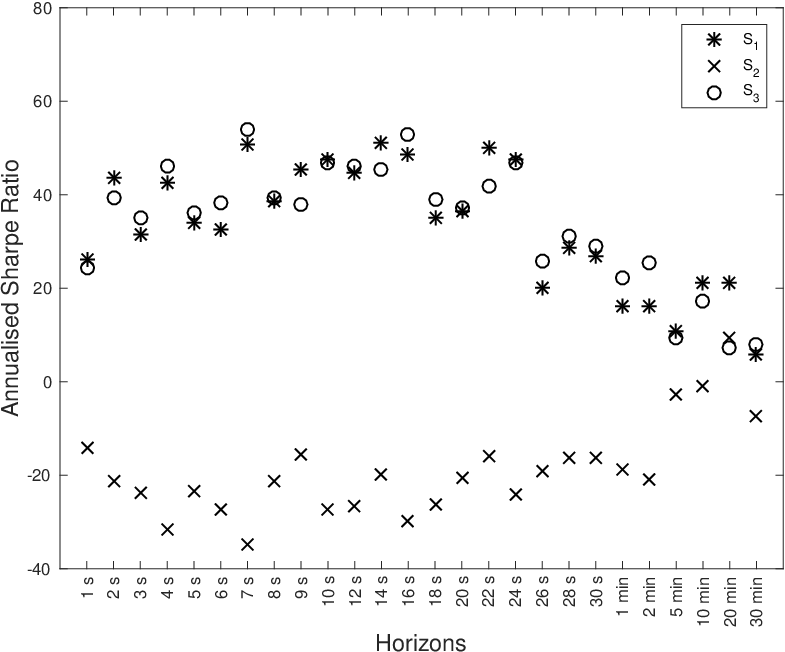
Institutional Trader Forecasting Ability

High-frequency data shows skillful traders have persistent predictive edge; one-standard-deviation improvement in forecasting ability raises position P&L by 1.02–1.19 units.

Fanfare 2Trading, Microstructure & ExecutionXinlei Hao et al.PDF

Annualized Sharpe Ratio of Stock-1 and Stock-2 for the three trading strategies during the second period
Figure 3 : Annualized Sharpe Ratio of Stock-1 and Stock-2 for the three trading strategies during the second period. S_{1} denotes Strategy 1, S_{2} denotes Strategy 2,…
15

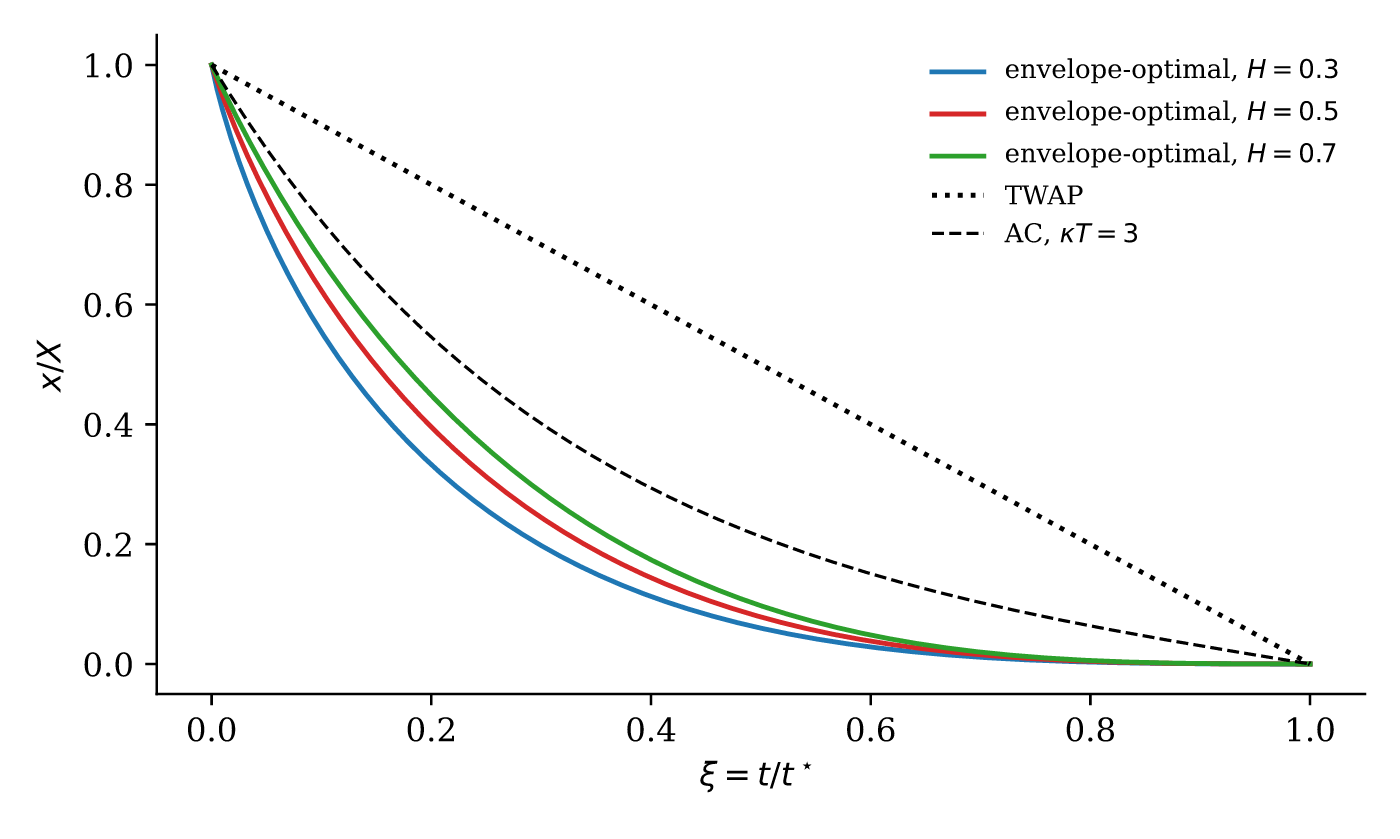
Execution Scheduling Under Concave Impact

Optimal execution windows maximize realized P&L by balancing alpha decay against concave impact costs; schedule shapes follow from convex optimization without depending on order size or impact coefficients.

Fanfare 3Trading, Microstructure & ExecutionDnyanesh Kulkarni and Revant NayarPDF

Inventory curves showing envelope-optimal execution versus TWAP and AC benchmarks over normalized time.
Figure 4: Universal inventory curves ( 22 ) ( \beta=1/2 ) against TWAP and an AC trajectory, each plotted over its own active period.
16

Adversarial Post-Training for LOB Models

Wasserstein GAN post-training on limit order book foundation models cuts error accumulation and improves realism by 17%, outperforming continued pre-training with far lower compute cost.

Fanfare 3Trading, Microstructure & ExecutionAlexandre Bismuth et al.PDF

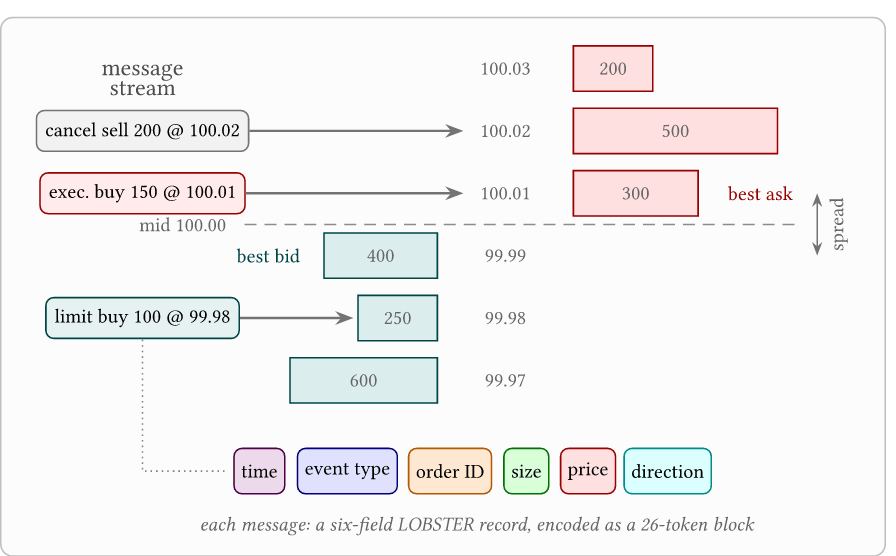
The limit order book and its message stream from records in LOBSTER format
Figure 2. The limit order book and its message stream from records in LOBSTER format. Bar length represents volume. A limit order book drawn as bid and ask volume bars a…
21

Nash Equilibria in Competitive Market Making

The research characterizes pure-strategy Nash equilibria for multi-market-maker games, proves equilibria exist under minimal assumptions, and validates theoretical predictions via simulation.

Fanfare 2Trading, Microstructure & ExecutionMatteo Onger and Luigi FoscariPDF

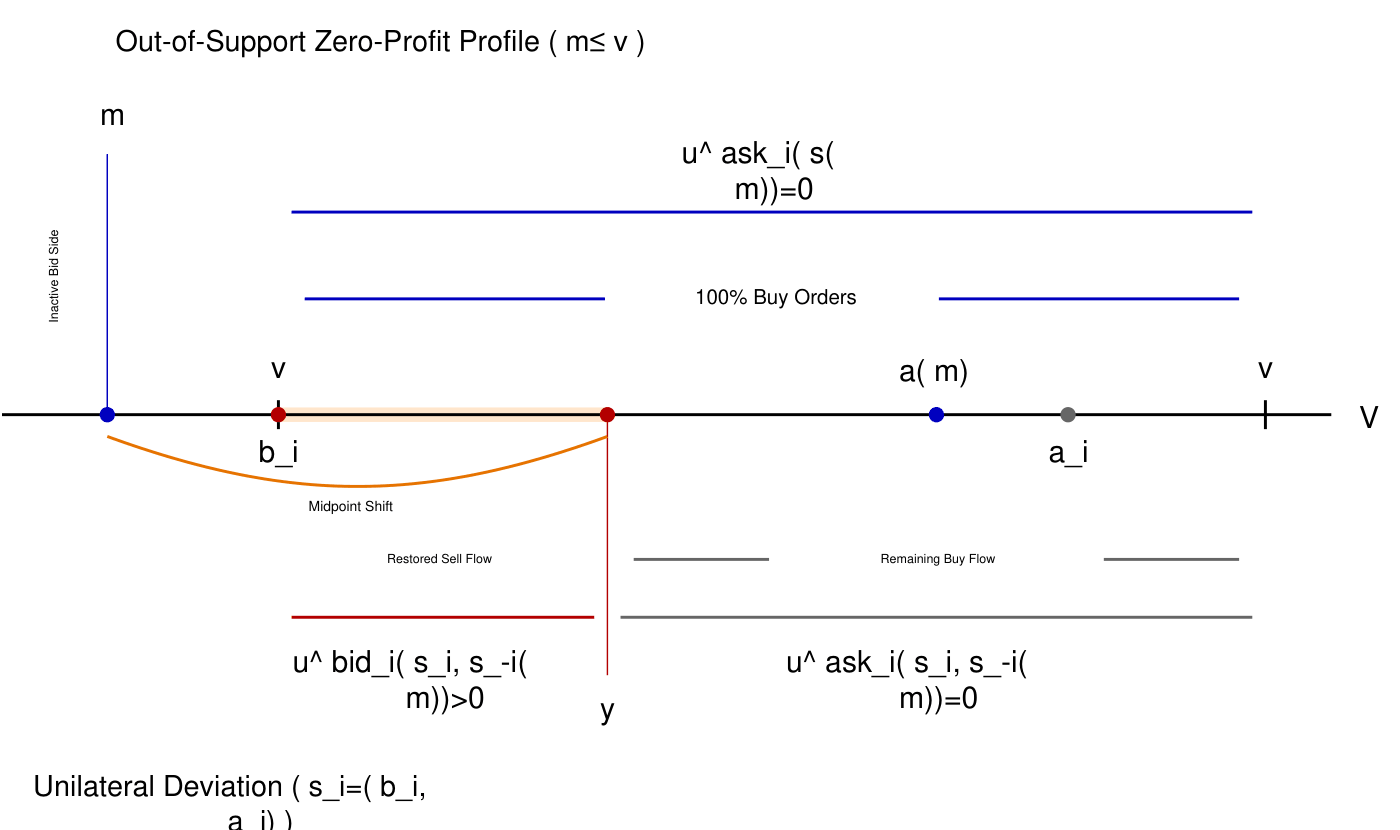
Profitable boundary deviation at an out-of-support candidate midpoint \widehat{m}\leq\underline{v} . Posting
Figure 3: Profitable boundary deviation at an out-of-support candidate midpoint \widehat{m}\leq\underline{v} . Posting \widetilde{b}_{i}=\underline{v} while withdrawing…
22

Probabilistic LOB Forecasting with Conditional Diffusion

LOBGrad combines autoregressive encoders with diffusion models for limit-order-book forecasting, reproducing microstructure facts and providing calibrated predictive intervals.

Fanfare 2Trading, Microstructure & ExecutionJunyu Chen et al.PDF

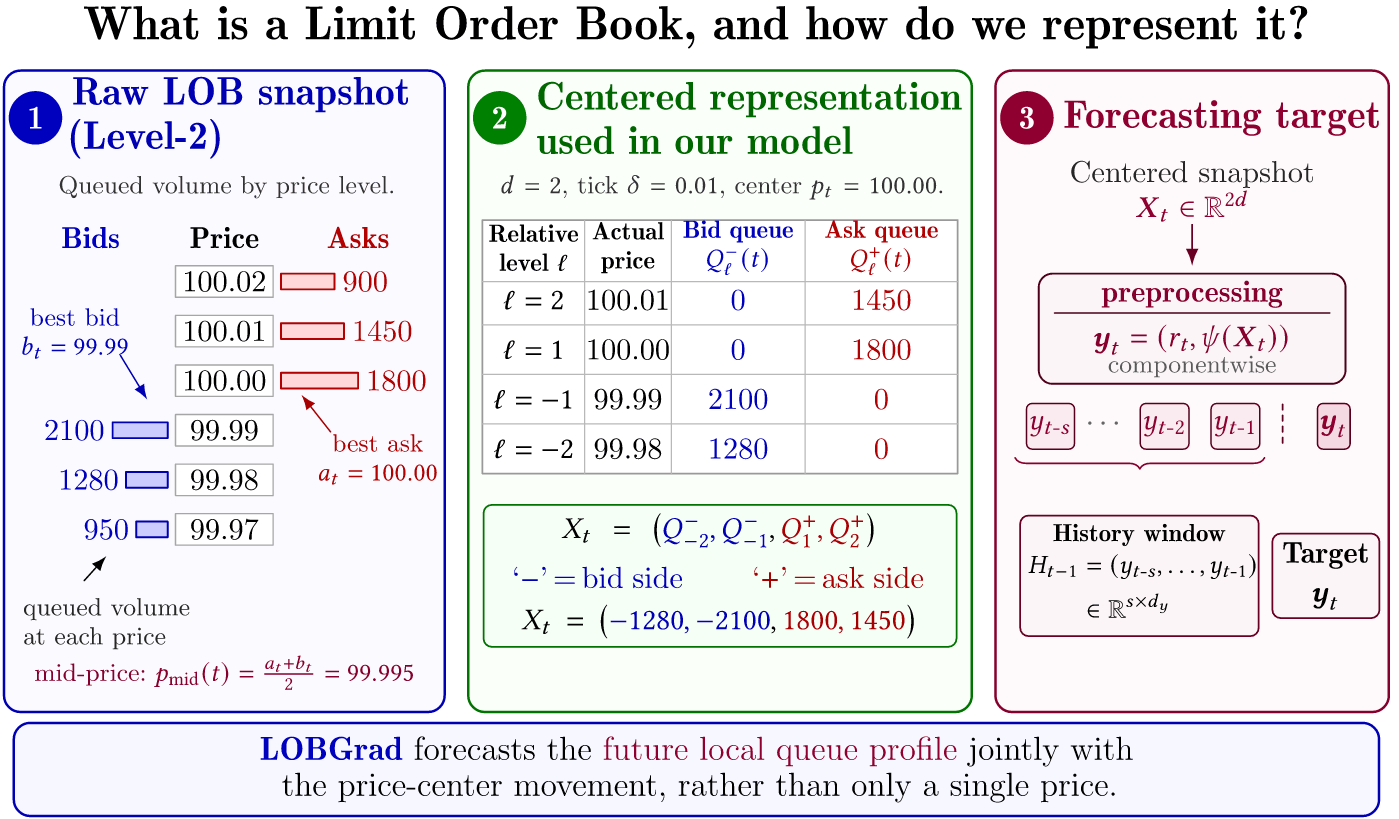
Illustration of the raw Level-2 LOB, the centered representation used in our model, and the forecasting target
Figure 1 . Illustration of the raw Level-2 LOB, the centered representation used in our model, and the forecasting target. Bid and ask volumes are arranged around a pric…
23

Diffusion Transformer for Limit-Order Supply Forecasting

OrderFlowDiT forecasts unnormalized bid-ask volume fields using unbalanced optimal transport regularization, reducing transport cost by 45.8 percent relative to mean squared error alone.

Fanfare 2Trading, Microstructure & ExecutionJung Hun Phee and Tucker BalchPDF

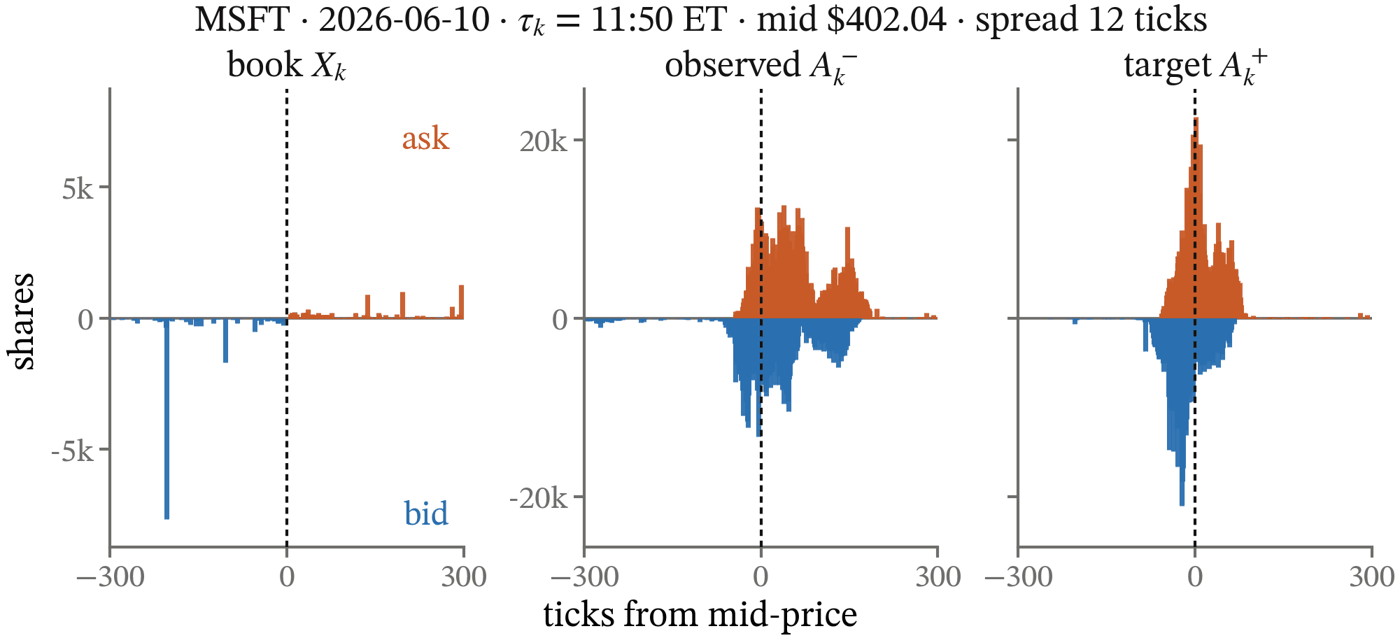
The data at one forecast boundary, within 300 ticks of the mid-price: the book snapshot X_{k} , the observed field
Figure 1. The data at one forecast boundary, within 300 ticks of the mid-price: the book snapshot X_{k} , the observed field A_{k}^{-} , and the target field A_{k}^{+} .…
29

Cooperative Multi-Agent Market Making

Decomposing a market maker into quoter and risk-manager agents trained with cooperative IPPO on Polymarket reduces held-out losses and improves quoting frequency versus baselines.

Fanfare 2Trading, Microstructure & ExecutionSkander LejmiPDF

Asset Pricing & Factors2

05

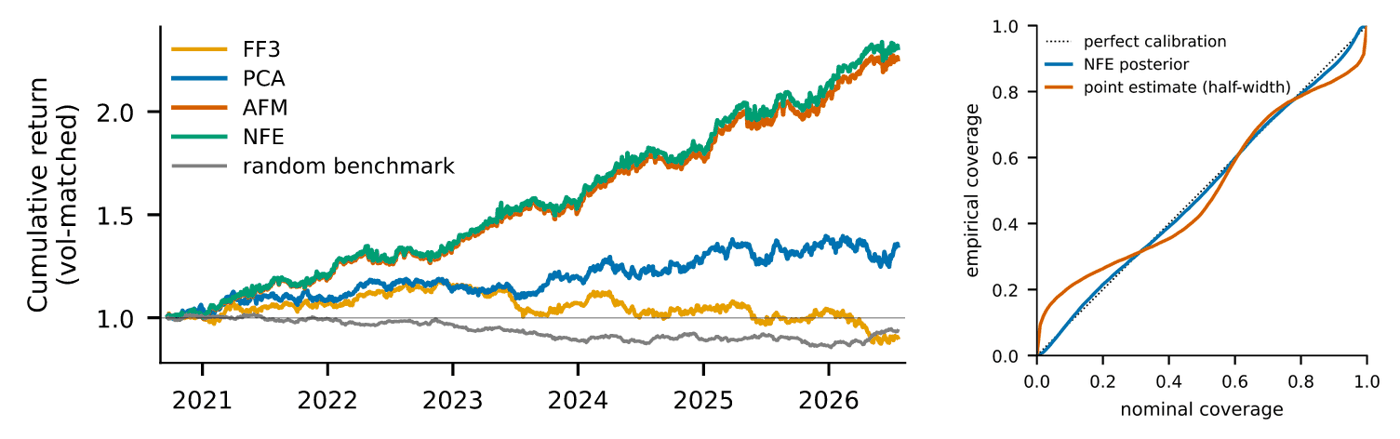
Neural Filtering for Statistical Arbitrage Uncertainty

A neural filter estimates posterior uncertainty over spread states and uses it to size positions, cutting the gap between forecasted and realized returns by two to eight times on Korean equities.

Fanfare 3Asset Pricing & FactorsMinkey ChangPDF

(a) Cumulative net return of the strategies of Table 1 , scaled to a common volatility; the random benchmark at its own
Figure 2. (a) Cumulative net return of the strategies of Table 1 , scaled to a common volatility; the random benchmark at its own scale. (b) Coverage of the true half-li…
28

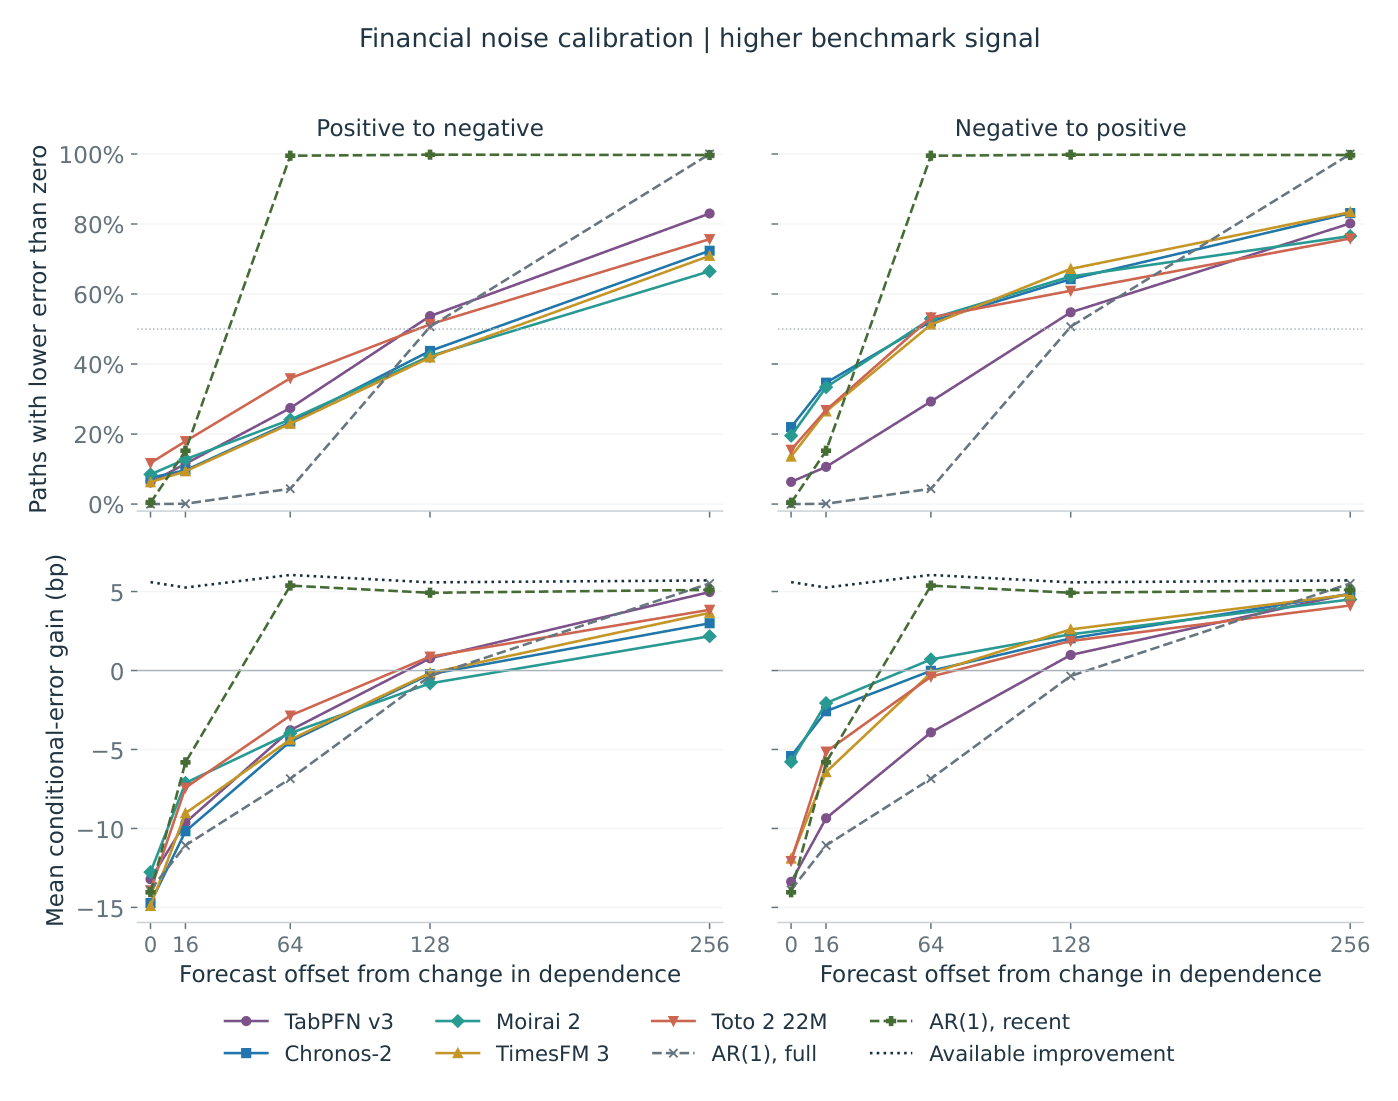
Conflicting History in Return Forecasts

Older observations that conflict with recent data reduce foundation models' probability of beating zero across all tested procedures, distinguishing signal extraction from conflicting-history resistance.

Fanfare 2Asset Pricing & FactorsLevent BulutPDF

Higher-signal financial process
Figure 4. Higher-signal financial process. The upper panels show usefulness at each offset; the lower panels show descriptive untrimmed mean gains and the mean available…

Derivatives & Volatility4

06

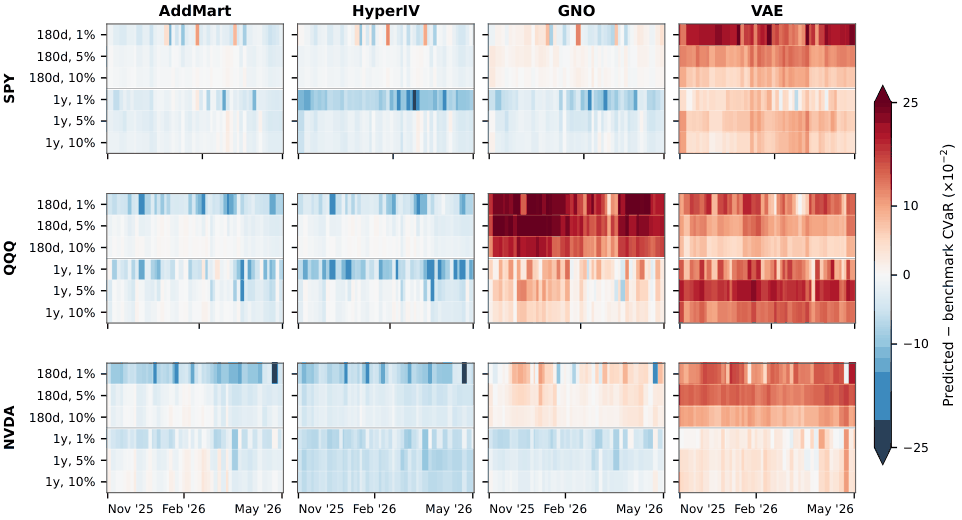
Arbitrage-Free IV Surfaces via Additive Martingales

AddMart reconstructs implied volatility surfaces from sparse quotes by mapping to martingale densities, ensuring no-arbitrage by construction and enabling crash probability estimation.

Fanfare 3Derivatives & VolatilityHaochen Luo et al.PDF

Signed CVaR residuals over the test period
Figure 5: Signed CVaR residuals over the test period. Columns denote reconstruction methods and rows denote assets. Within each panel, the heatmap rows combine the 180-d…
08

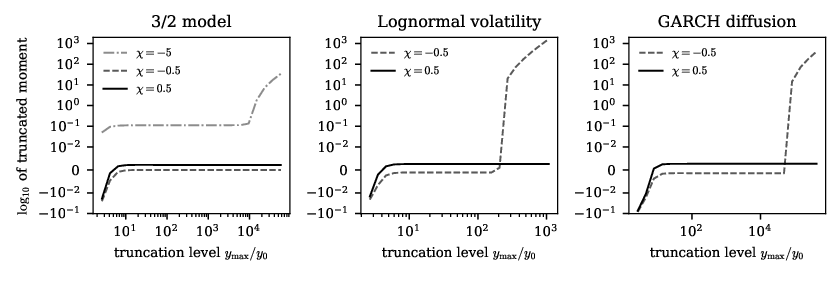
DSINC Method for Non-Affine Stochastic Volatility

The paper extends damped-sinc methods beyond Heston to general one-factor stochastic-volatility models including the 3/2 and SABR, achieving basis-point accuracy with comparable computational cost.

Fanfare 3Derivatives & VolatilityAndrey ItkinPDF

Truncated moments for three stochastic volatility models on logarithmic scale
Figure 1: Truncated moments {\mathbb{E}}[(S_{T}/S_{0})^{\chi}] for T=0.5 , computed by the fixed-frequency solver with absorption at the truncation level y_{\max} , on a…
12

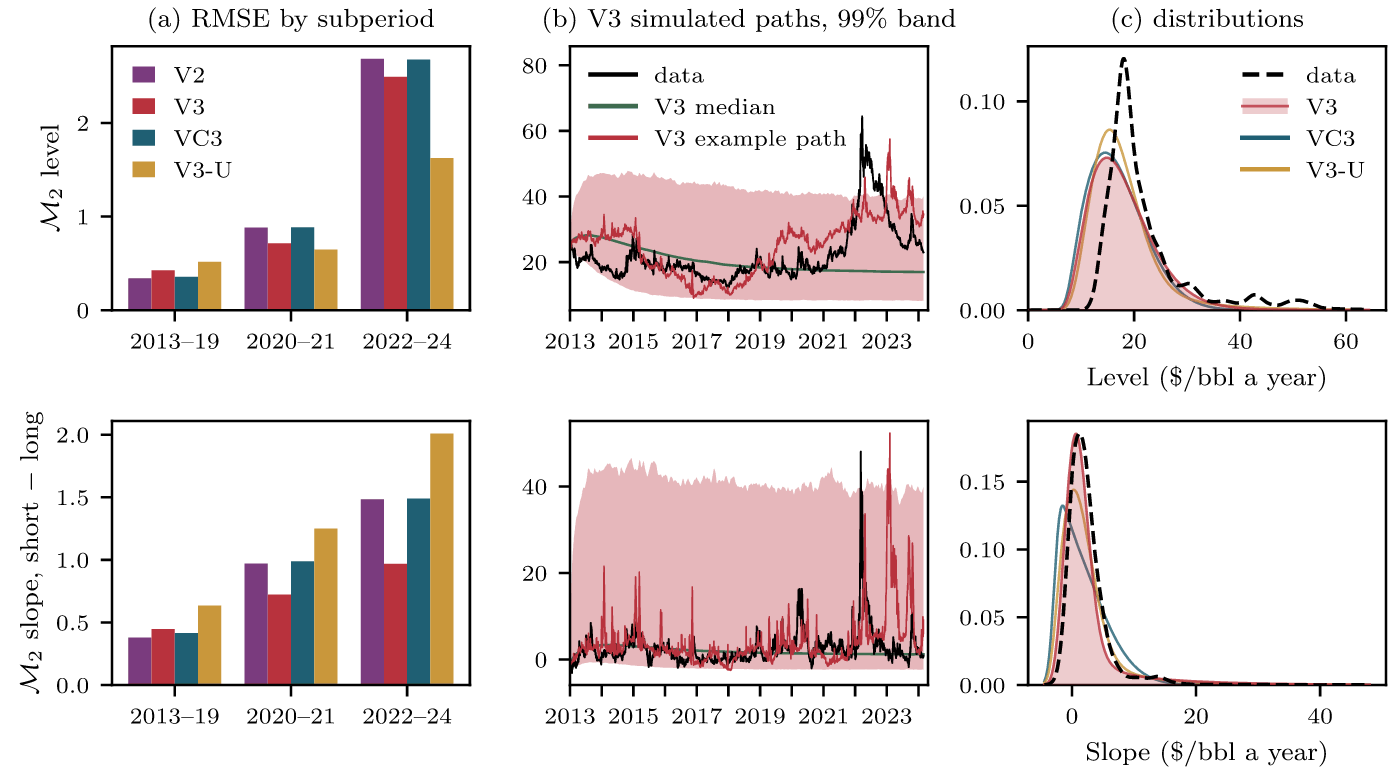
Arithmetic Models for Commodity Options

An arithmetic stochastic volatility model for crude oil provides semi-closed-form pricing for vanilla and calendar spread options, hedges daily risk effectively, and improves fit over geometric models.

Fanfare 2Derivatives & VolatilityMalthe Rauh Johansen et al.PDF

Model-free volatility Level (mean over maturities from 42 to 210 business days, top) and slope (42-day less 210-day
Figure 9: Model-free volatility Level (mean over maturities from 42 to 210 business days, top) and slope (42-day less 210-day value, bottom) of \mathcal{M}_{2} , in $/bb…
20

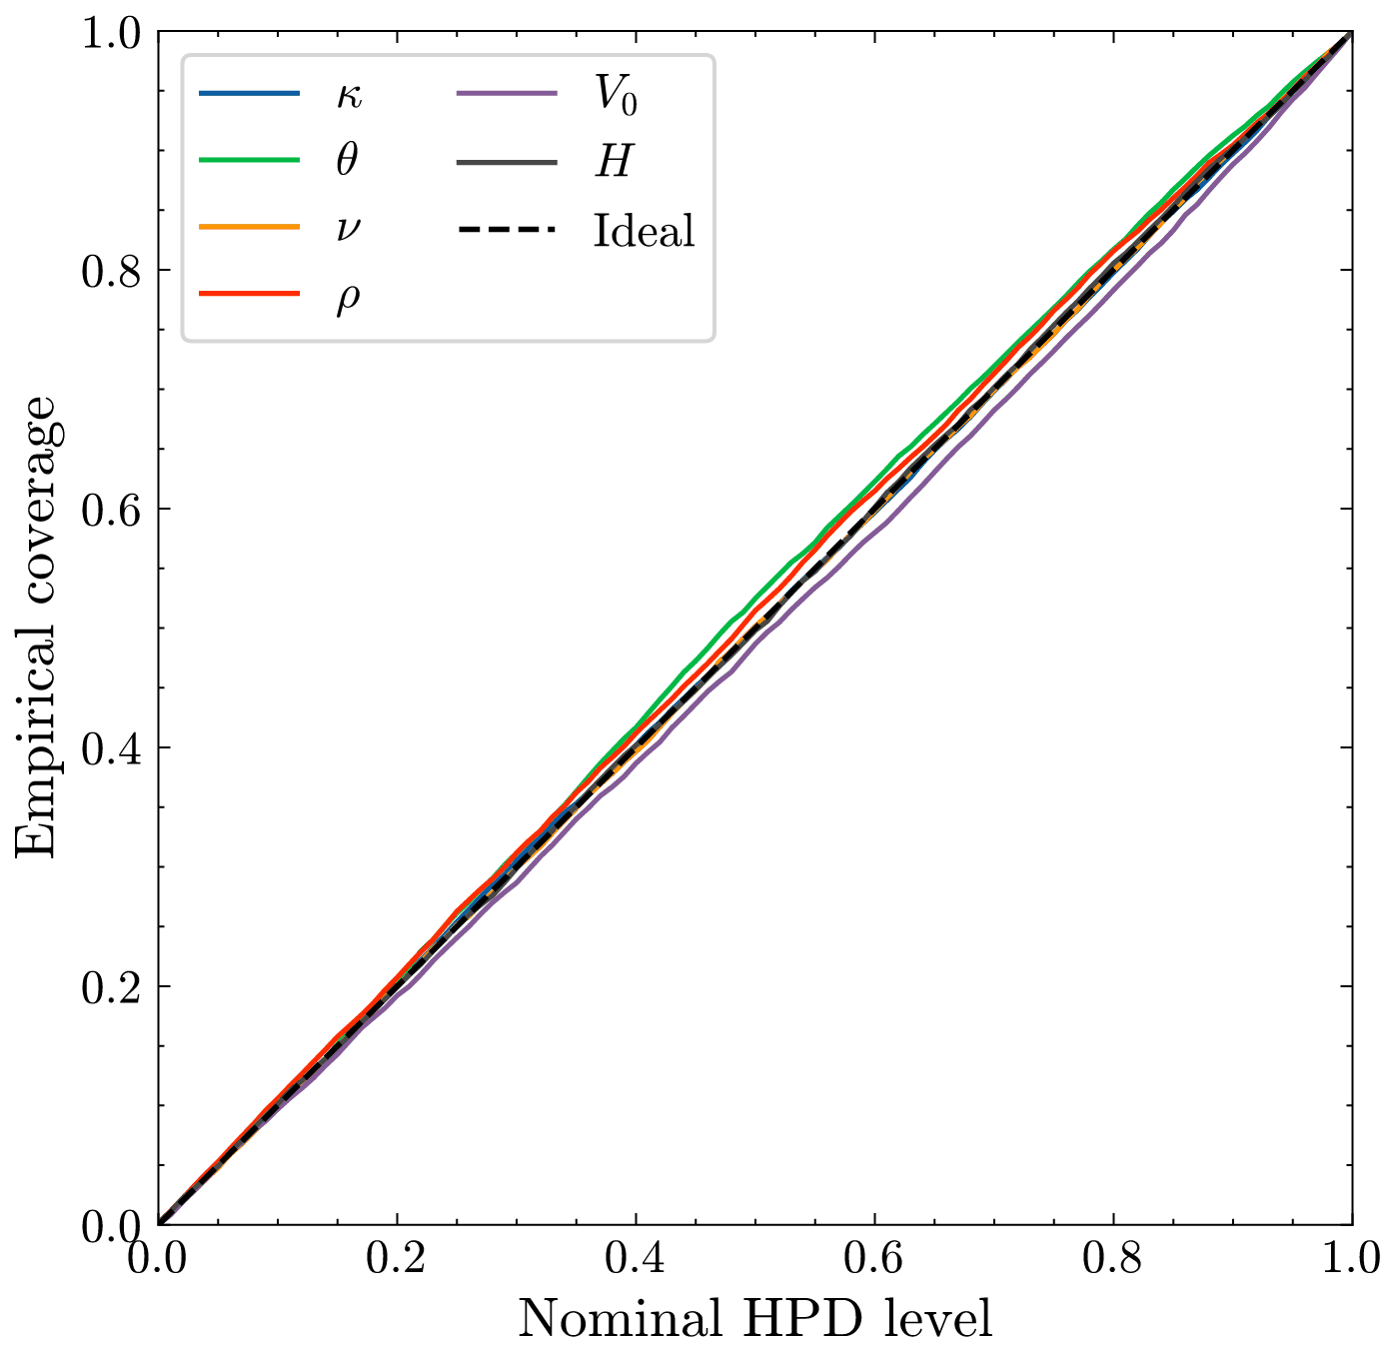
Rough Heston Posterior Inference

Simulation-based inference learns posterior distributions for rough Heston parameters and propagates them through neural pricers to deliver calibrated uncertainty intervals for exotic options.

Fanfare 2Derivatives & VolatilityDamiano Brigo et al.PDF

Empirical coverage of highest posterior density regions versus nominal level, showing excellent calibration.
Figure 2 . Empirical highest posterior density (HPD) regions coverage of the learnt TRE conditional posteriors over the held-out test set. We note good coverage results,…

Crypto & DeFi2

09

Dividend Fairness in Crypto Perpetuals

Premium-index funding cannot replicate shareholder cash flows for dividend-paying assets; fairness requires discrete event credits matching dividend atoms, not continuous basis adjustment.

Fanfare 3Crypto & DeFiDonghwa Seo et al.PDF

17

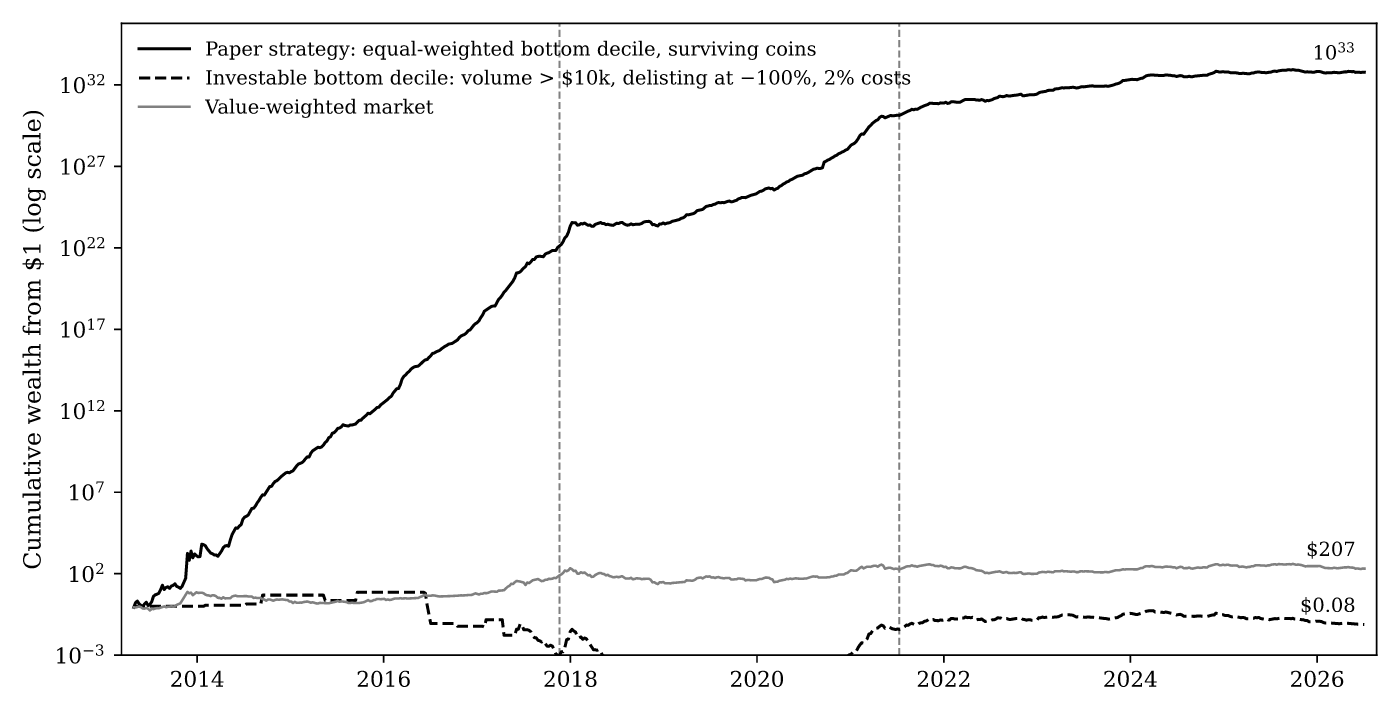
Efficiency and Survivor Bias in Cryptocurrency Markets

Testing weak-form efficiency on 8,970 cryptocurrencies over thirteen years, the study finds persistent asymmetry in market ranking but reveals that neglected assets lack liquidity rather than predictability.

Fanfare 3Crypto & DeFiAntonis Ballis and Christos IoannidisPDF

Cumulative wealth from $1 invested in: the paper strategy (equal-weighted bottom decile of surviving coins, weekly
Figure 2: Cumulative wealth from $1 invested in: the paper strategy (equal-weighted bottom decile of surviving coins, weekly rebalancing); the investable bottom decile (…

Portfolio & Allocation5

10

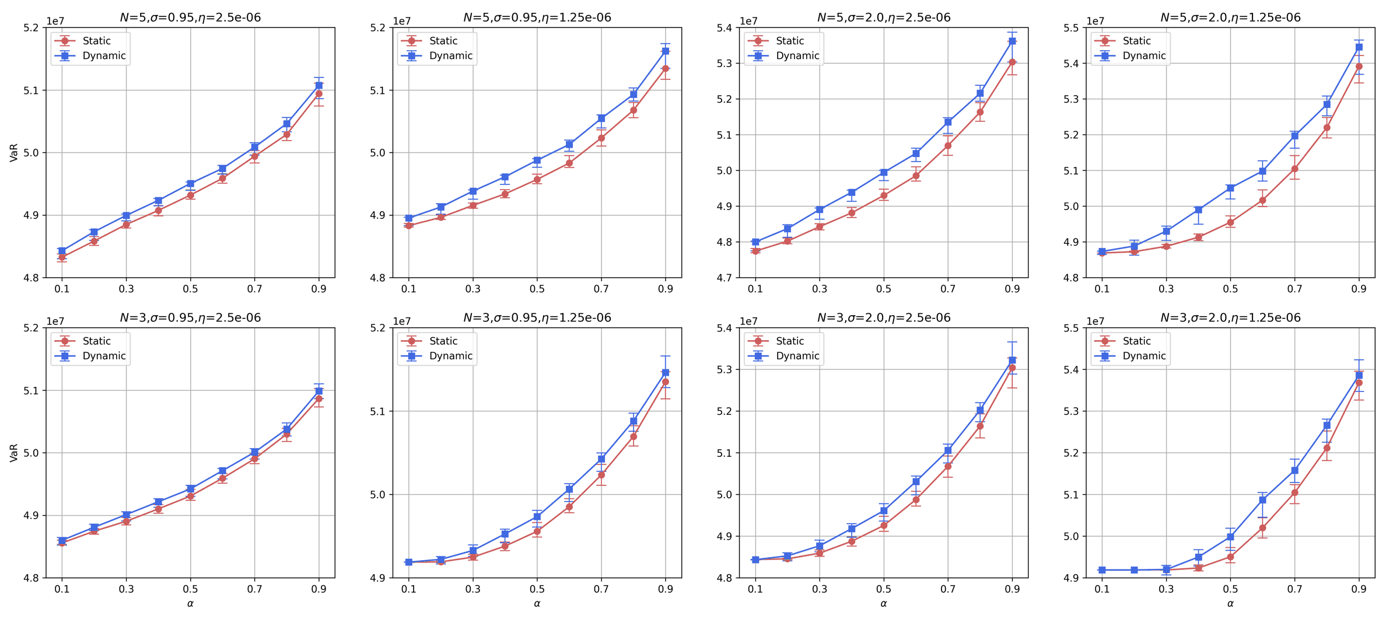
Dynamic Programming for VaR in Continuous Spaces

The paper establishes validity of dynamic programming equations for Value-at-Risk objectives in continuous state and action spaces, enabling optimal execution problems with VaR goals.

Fanfare 3Portfolio & AllocationXian Chen et al.PDF

Comparison of static and dynamic strategies under different parameter settings for Regime 2
Figure 2: Comparison of static and dynamic strategies under different parameter settings for Regime 2
13

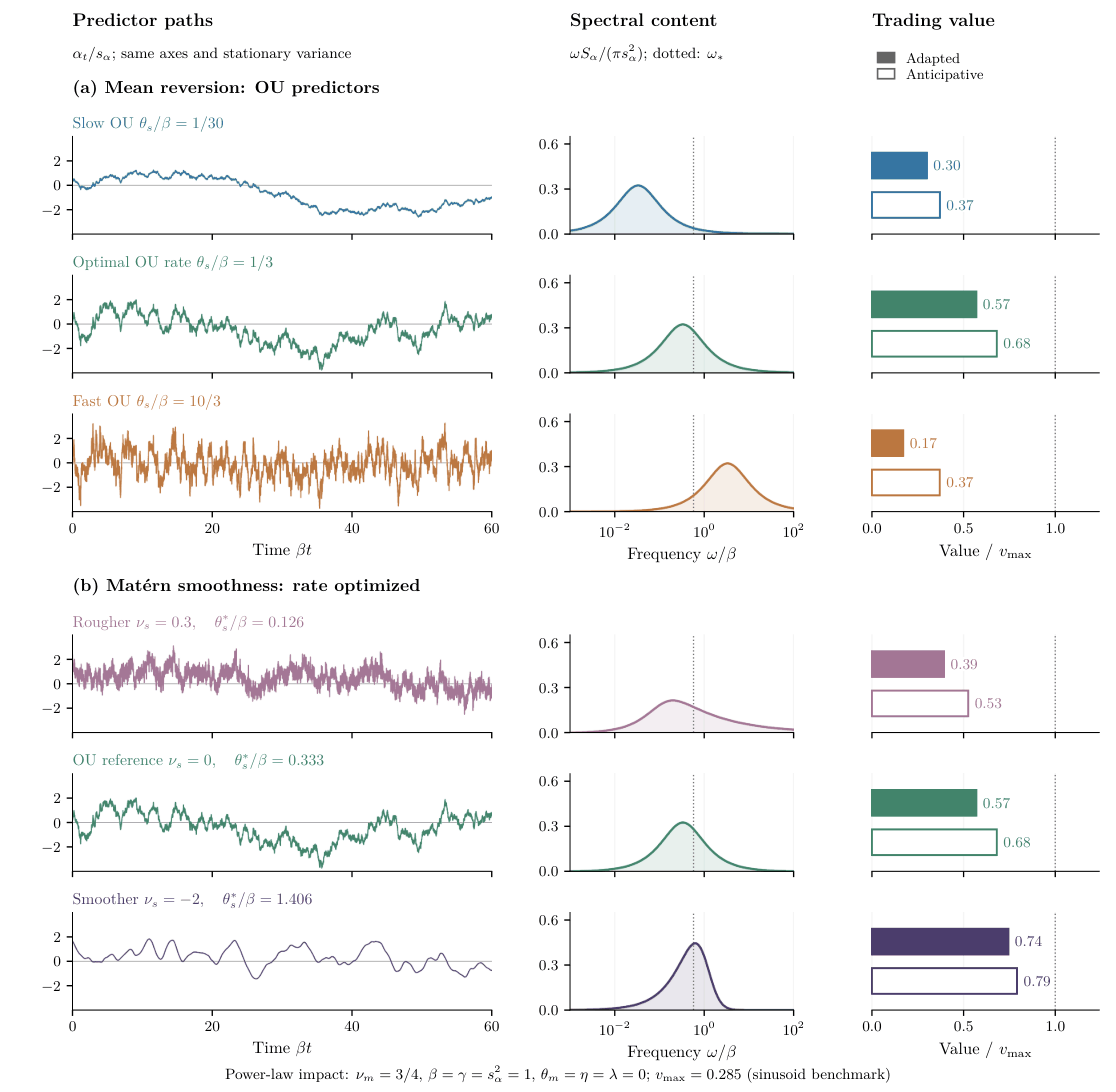
Optimal Trading Filters Under Impact

Wiener-Hopf factorization yields optimal trading filters for return forecasts under transient price impact, showing fractional filters and the value of mean-reversion timing for signals.

Fanfare 2Portfolio & AllocationMatteo SmerlakPDF

Signal speed and Matérn smoothness at fixed predictor variance and market costs
Figure 2: Signal speed and Matérn smoothness at fixed predictor variance and market costs. (a) OU predictors with different decay rates. (b) Matérn exponents \nu_{s}=0.3…
19

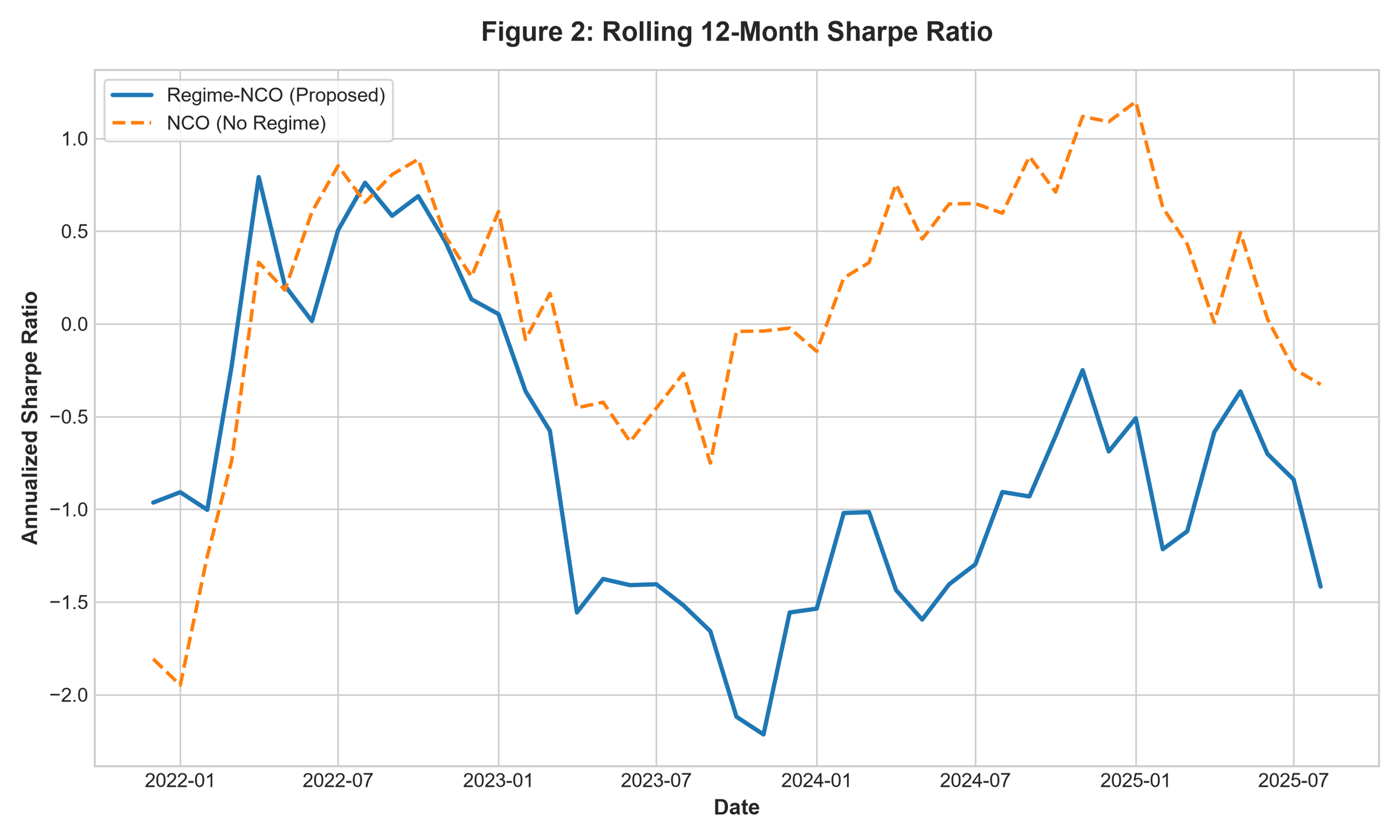
Regime-Aware Tactical Asset Allocation with NCO

The study integrates market regime detection with Nested Clustered Optimization to build multi-asset portfolios, showing improved risk-adjusted returns and reduced downside risk versus regime-agnostic approaches.

Fanfare 2Portfolio & AllocationSupriadi and Bambang SiswoyoPDF

Rolling 12-month Sharpe ratio comparing regime-aware HMM-NCO versus standard NCO strategies over time.
Fig. 4: Rolling 12-month Sharpe ratio comparison between the proposed HMM-NCO (regime-aware) and standard NCO (regime-agnostic) strategies.
24

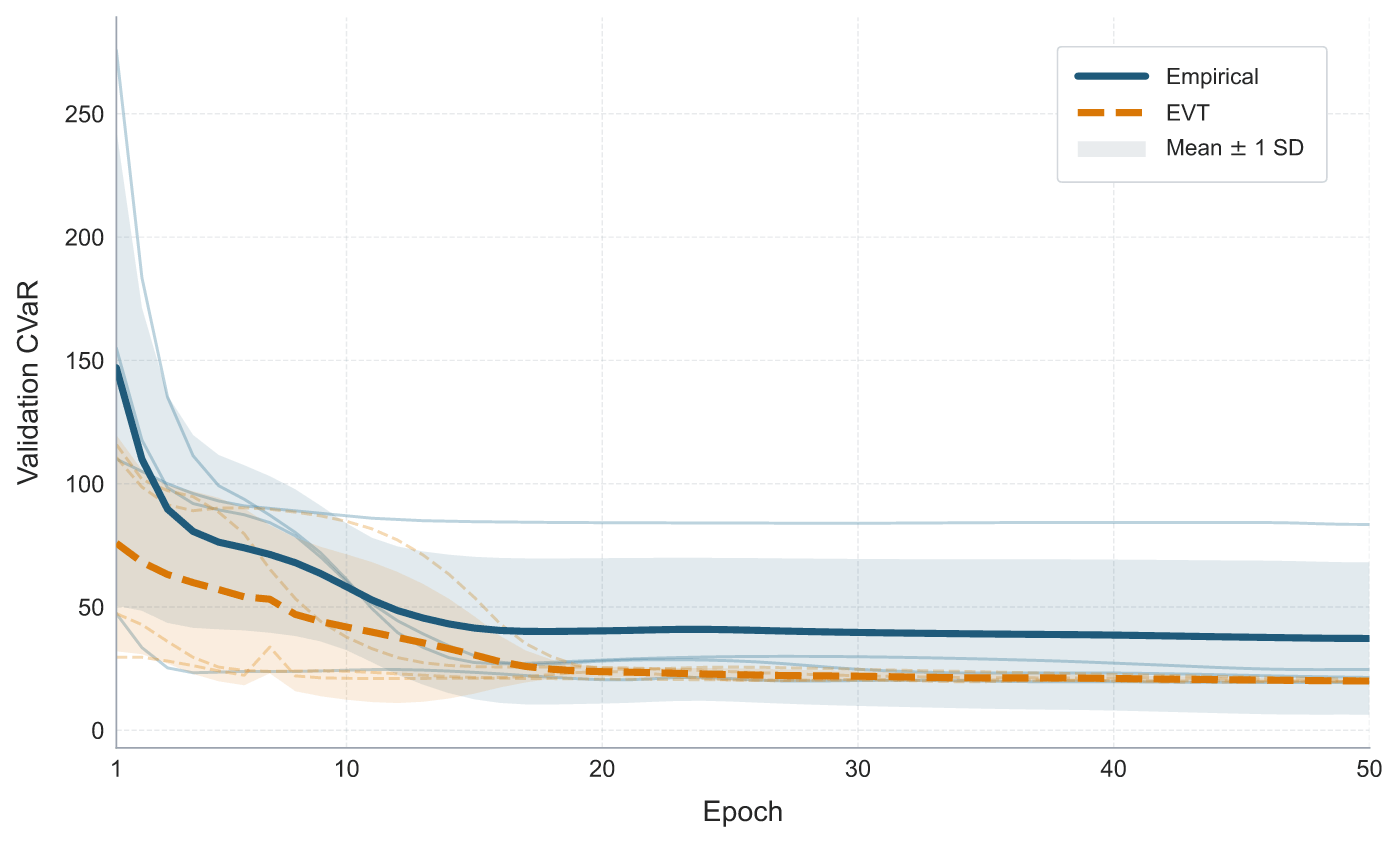
Extreme Value Theory for Deep Hedging Policies

The study applies extreme value theory to train neural hedging policies on tail risk, achieving lower losses under extreme scenarios when relevant observations are scarce.

Fanfare 2Portfolio & AllocationCarlos Pérez Octavio Mendoza and Frédéric GodinPDF

Validation \mathrm{CVaR}_{0.999} throughout training under the empirical and EVT-based optimization approaches
Figure 2: Validation \mathrm{CVaR}_{0.999} throughout training under the empirical and EVT-based optimization approaches.
30

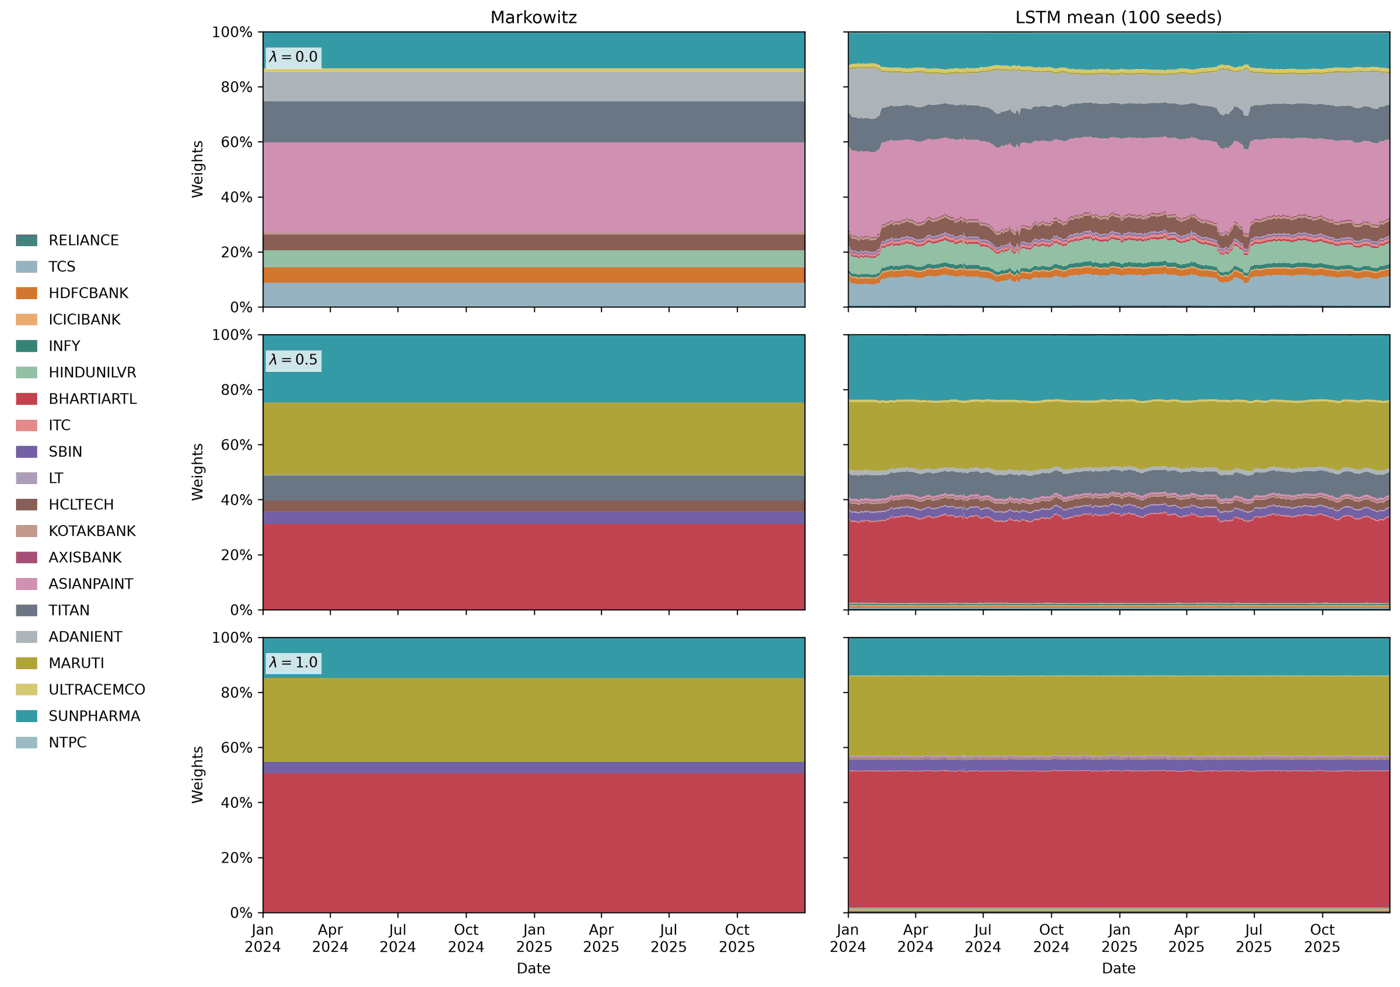
Expert Views Improve Markowitz Portfolios

The research shows that even small amounts of directionally correct expert information materially improve portfolio allocations in both classical and machine-learning frameworks.

Fanfare 2Portfolio & AllocationOjas Kumar et al.PDF

Portfolio allocations over 2024–2025 for \lambda=0 , 0.5 , and 1 . The left column shows the Markowitz target
Figure 3 : Portfolio allocations over 2024–2025 for \lambda=0 , 0.5 , and 1 . The left column shows the Markowitz target allocations, while the right column shows the me…

Also notable3

14

Worst-Case Risk via Spectral Measures

A convex variational theory unifies worst-case risk evaluation across different ambiguity sets, yielding closed-form solutions and algorithms for portfolio selection under Wasserstein and distributional uncertainty.

Fanfare 3Risk, Credit & BankingJianjun Gao et al.PDF

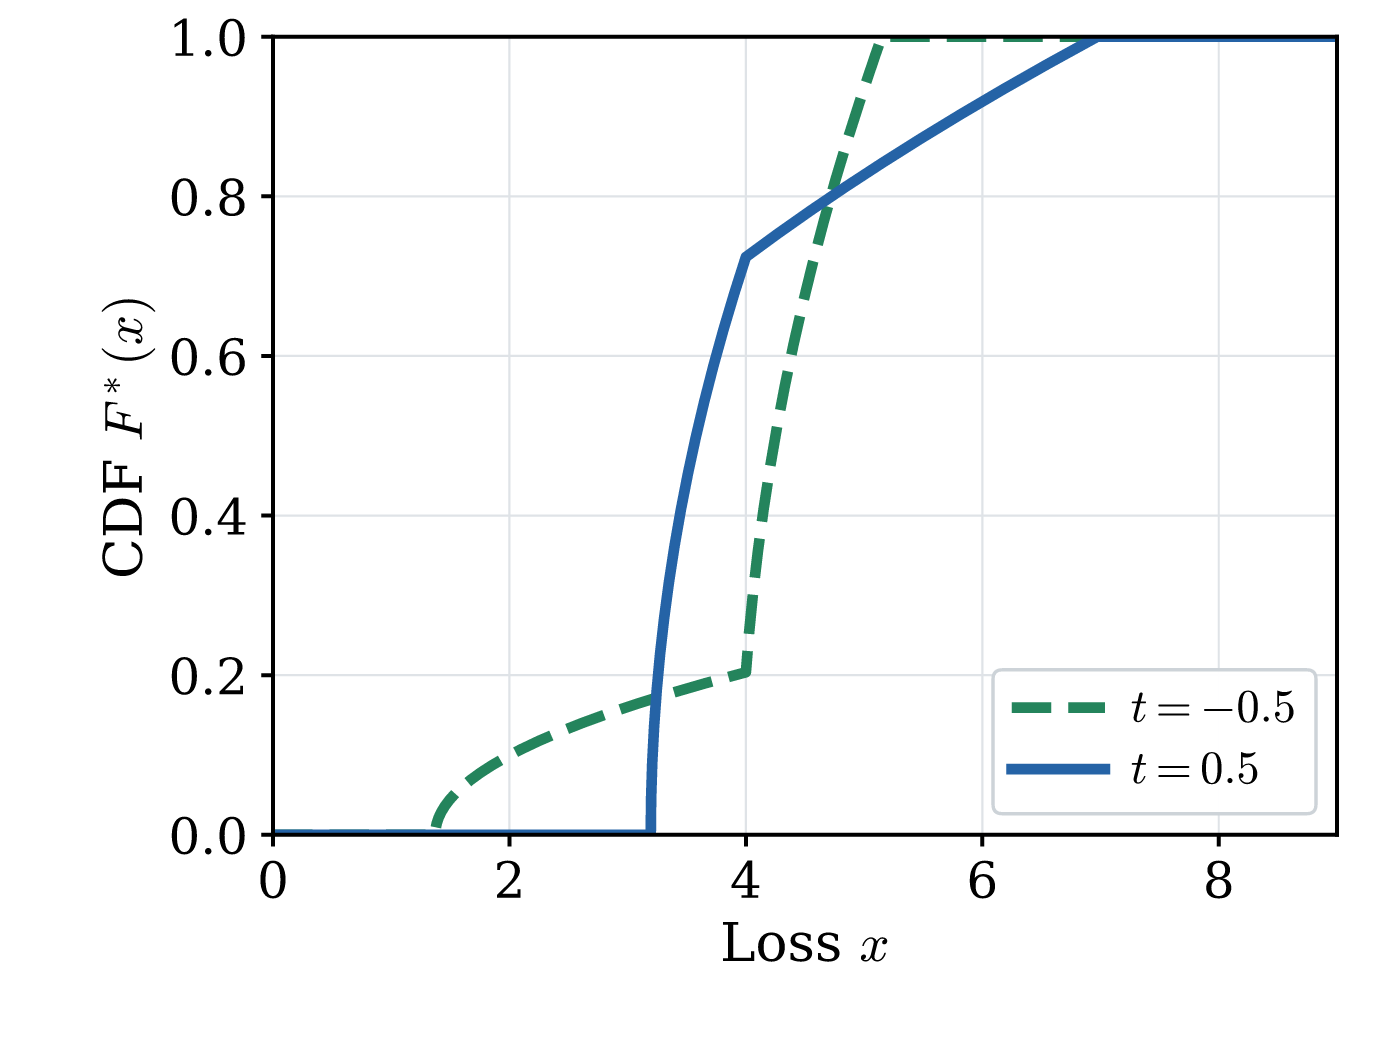
Partial-moment ambiguity with \mu=4 , \sigma=1 , \beta=3 , and admissible support [0,15] . (a) Worst-case CDFs at t=\pm
Figure 3 : Partial-moment ambiguity with \mu=4 , \sigma=1 , \beta=3 , and admissible support [0,15] . (a) Worst-case CDFs at t=\pm 0.5 . (b) Worst-case SRM for t\in[-0.7…
18

Neural Network Trend Inflation Estimation

Deep-π* attributes trend inflation movements to macroeconomic indicators via neural networks, forecasting inflation more accurately than classical models and signaling the 2021 surge earlier.

Fanfare 3Econometrics & ForecastingCarlos Montes-GaldónPDF

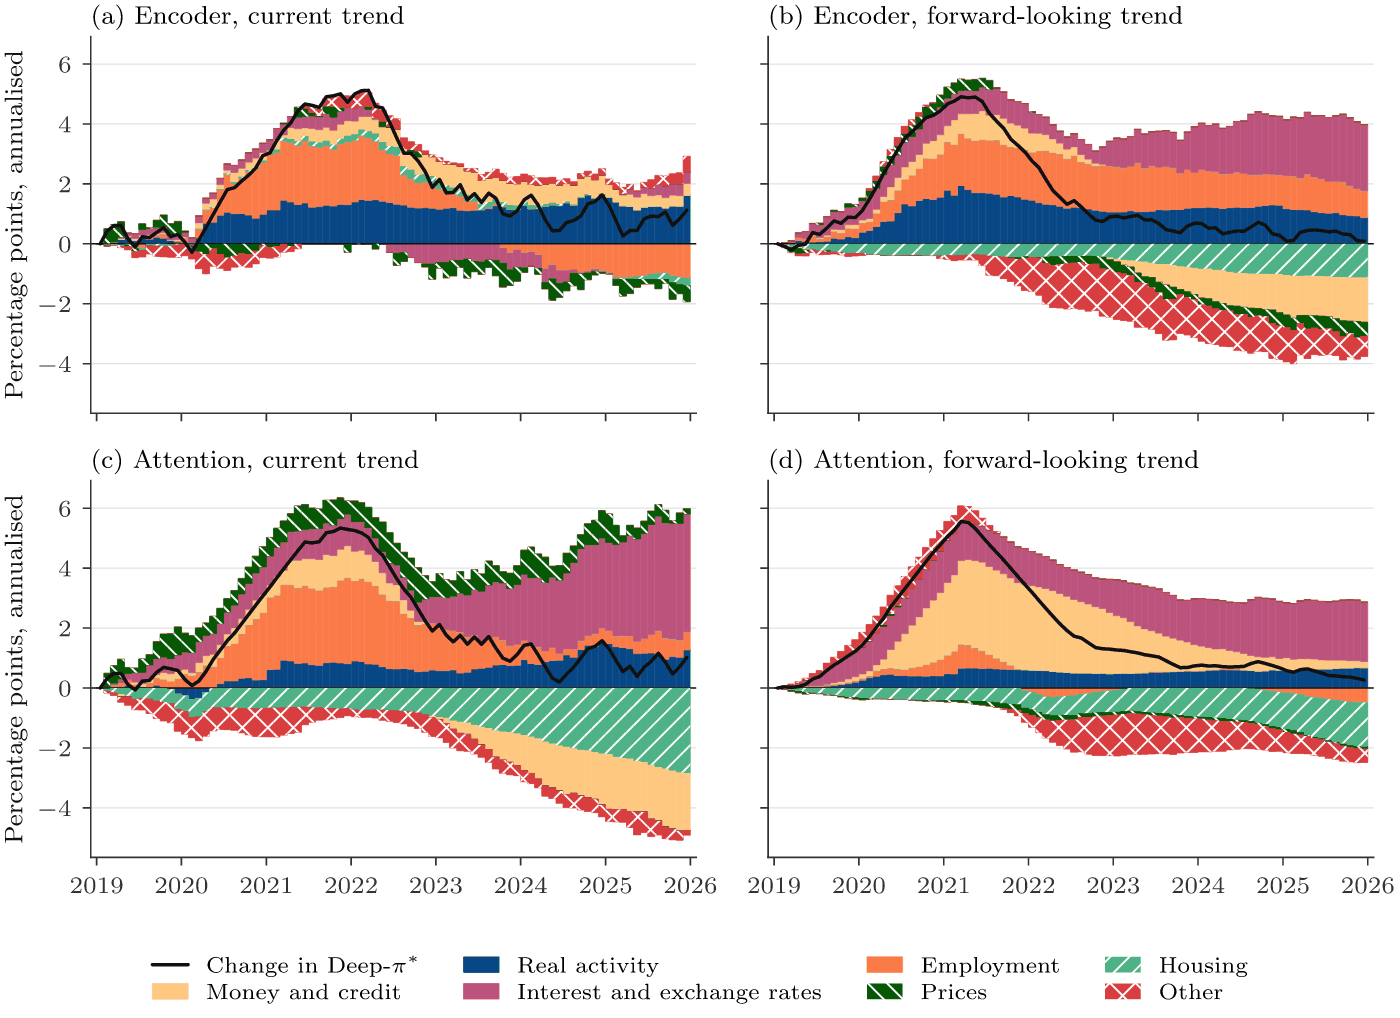
The drivers of the trends since January 2019
Figure 7 : The drivers of the trends since January 2019. Contributions of the groups of indicators to the change in Deep- \pi^{*} since January 2019 (exact group Shapley…
25

LLMs on SEC Filings and Stock Market Reactions

Analysis of 13 language models on 45,964 Form 10-Q filings shows finance-specialized models produce modest advantages in return ranking but lag analyst consensus in earnings forecasts.

Fanfare 2LLMs & TextShengkun Wang et al.PDF

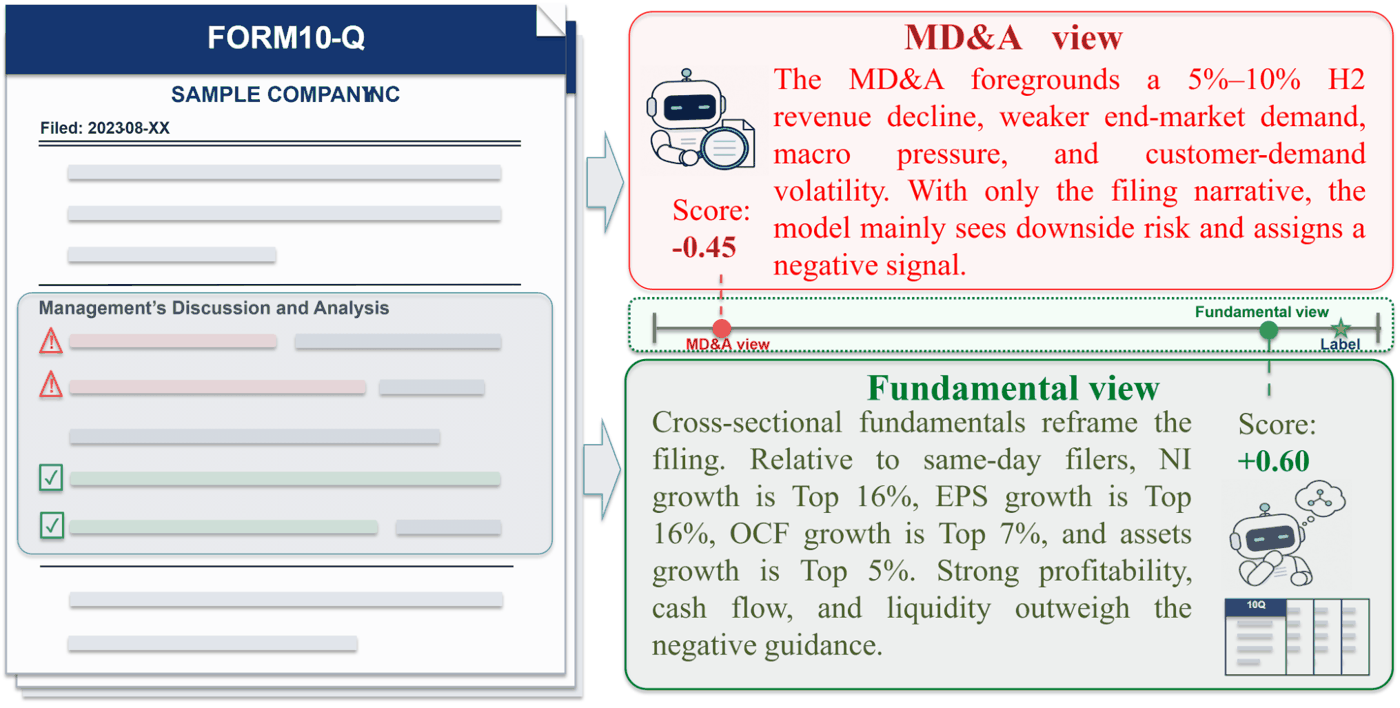
Adding cross-sectional fundamental ranks to the same 10-Q MD&A can reverse the return signal inferred from the filing
Figure 1. Adding cross-sectional fundamental ranks to the same 10-Q MD&A can reverse the return signal inferred from the filing. A schematic shows the same 10-Q MD\&A pr…

SSRN

New working papers in finance, economics and ML

30 papers · 1 figures

Risk, Credit & Banking6

01

ML Value-at-Risk Validation Under Regime Shifts

The study shows that machine-learning VaR models passing standard backtests breach risk limits two to nine times worse in stressed regimes, revealing false comfort in current regulatory validation.

Fanfare 4Risk, Credit & BankingNiraj Neupane

05

Quantitative Easing's Loan Renegotiation Channel

Large purchases of mortgage-backed securities prompt exposed banks to renegotiate existing corporate loans on lender-favorable terms, reducing borrower investment by 6 percent.

Fanfare 4Risk, Credit & BankingLin Xie and Mian Liu

08

Monetary Policy Uncertainty and Bank Lending

Higher monetary policy uncertainty reduces banks' risk-bearing capacity, widening the lending gap between well-capitalized and undercapitalized banks by 1.65 percent in riskier credit.

Fanfare 3Risk, Credit & BankingFatih Altunok et al.

13

Nonbank Lending to Distressed Firms

As firms approach bankruptcy, lending shifts to nonbanks and fintechs despite higher losses given default, revealing worse information and more pro-cyclical credit supply during downturns.

Fanfare 3Risk, Credit & BankingManasa Gopal et al.

14

Banks' Risk Assessment of AI-Exposed Firms

After ChatGPT, banks lower default risk for AI-exposed borrowers by about 5 percent but compress credit to market leaders, reordering risk in ways that predict future credit losses.

Fanfare 3Risk, Credit & BankingBruno Buchetti et al.

30

Copulas for Tail Risk in Market Crashes

Asymmetric Clayton and Gumbel copulas and fat-tailed Student-t copulas substantially outperform Gaussian copulas at capturing lower-tail dependence and crisis losses.

Fanfare 2Risk, Credit & BankingHenry Mayambu

Asset Pricing & Factors5

02

Option-Implied Moments Predict Returns and Volatility

Using 3.8 billion option contracts, the study finds implied kurtosis predicts five-day returns with 2.33 Sharpe ratio and improves volatility forecasting by 23.3 percent.

Fanfare 4Asset Pricing & FactorsSimon-pierre Boucher

06

Systemic Liquidity Risk and Cross-Sectional Returns

An intertemporal model shows that bank maturity transformation creates priced systemic risk where high liquidity-beta assets underperform by six to seventeen percent quarterly during stress.

Fanfare 3Asset Pricing & FactorsBingsen Jia and Rose Neng Lai

07

Industrial Emissions Forecast Equity Risk Premium

When U.S. industry runs hot measured by carbon emissions, expected market returns fall 4.2 percentage points the next year, forecasting returns up to five years ahead.

Fanfare 3Asset Pricing & FactorsYunlong Chen et al.

09

Asset Pricing With Return-SDF Cumulants

Log expected excess returns decompose exactly into joint cumulants of returns and the stochastic discount factor, explaining thirty-one anomaly factors with three structural parameters.

Fanfare 3Asset Pricing & FactorsRobert Parham et al.

29

Cross-Asset Volatility Transmission Connectedness

Analysis of ten instruments finds U.S. equity futures are net transmitters of volatility shocks while cryptocurrencies became net receivers in 2024-2026, with total connectedness peaking in 2025.

Fanfare 2Asset Pricing & FactorsSimon-Pierre Boucher

ML & AI Methods5

03

Visual Chart Similarity Predicts Stock Returns

Vision models retrieve visually similar price charts from three decades of history; similar historical patterns predict future cross-sectional returns, especially for stocks with limits to arbitrage.

Fanfare 4ML & AI MethodsHui Chen et al.

04

AI Intensity and Firm Financing

As firms adopt AI, they hold less cash, shift from revolving to term credit, pay higher spreads, and rely more on non-bank lenders while expanding investment and employment.

Fanfare 4ML & AI MethodsSuleyman Gozen

17

Placebo Test for Credit Features

A placebo test reveals that features like central bank tone can raise credit model accuracy merely by indicating when loans were made, not by predicting defaults.

Fanfare 3ML & AI MethodsNawaz Muhammad

18

Machine Learning for Equity Timing

Five pre-registered hypotheses about machine learning for volatility, drawdowns, trend filtering, stock ranking, and news failed validation on a 2025-26 holdout despite passing development tests.

Fanfare 3ML & AI MethodsPrashant Malan

20

VQuant: LLM Architecture for Finance

A platform couples a language model with deterministic execution to turn natural-language requests into auditable reports where every figure is from live data or reproducible code, not model hallucination.

Fanfare 3ML & AI MethodsSimon-Pierre Boucher

Portfolio & Allocation3

10

Price Impact and Fire Sales in Crowded Trades

A model of factor crowding shows that forced exits amplify shocks up to sixfold and shift crowding costs from average returns into tail losses.

Fanfare 3Portfolio & AllocationLudwig B. Chincarini

25

Dynamic Factor Timing With Transaction Costs

A strategy dynamically allocating across 50 smart-beta factors based on past returns and covariances significantly outperforms static allocation even with transaction costs included.

Fanfare 2Portfolio & AllocationVaibhav Lalwani and Ashok Gunturu

26

Volatility Timing in Crowded Factors

Crowding combined with volatility and market stress improves the risk-adjusted performance of volatility-managed factors more than standard volatility management alone.

Fanfare 2Portfolio & AllocationXuan Feng

Trading, Microstructure & Execution5

12

Passive Investing and Price Discovery Breakdown

An agent-based model shows how rising passive market share starves the limit order book of price-sensitive capital, leading to deteriorating price discovery and emergent liquidity crises.

Fanfare 3Trading, Microstructure & ExecutionMarcos Garcés

15

Automated Trading Homogeneity and Systemic Risk

A model shows how correlated automated trading decisions generate feedback and forced liquidations, with systemic risk rising as market depth shrinks relative to automated activity.

Fanfare 3Trading, Microstructure & ExecutionSiwon Lee

23

Stock Market Cycles and Regimes

A new methodology identifies bear and bull markets by bandwidth calibration, finding median durations of 74 and 294 days, and fits regime-switching models on cumulative rather than daily returns.

Fanfare 3Trading, Microstructure & ExecutionLieven Baele and Geert Bekaert

24

Price Impact in Prediction Markets

Using observable outcomes in prediction markets to identify efficient prices, the study decomposes impact into price-moving and anticipation components, finding informed traders earn mostly through prediction.

Fanfare 3Trading, Microstructure & ExecutionOliver Padmaperuma and Andre Guettler

28

Bootstrap Diagnostics of FX Strategy Edge

Resampling bootstrap of ten walk-forward validated FX strategies places their median expectancy at the 77th percentile of its own distribution, indicating modest optimization bias.

Fanfare 2Trading, Microstructure & ExecutionShepherd Mahadzva

Derivatives & Volatility4

19

Prediction Markets Discipline Option Pricing

Prediction-market prices serve as risk-adjusted state prices to measure event probability and information arrival, improving option valuation and revealing market frictions in elections and Brexit.

Fanfare 3Derivatives & VolatilityMichael Hanke et al.

21

Candlestick Words Improve Intraday Volatility

Encoding intraday bars as descriptive words adds 1.7 to 3.7 points of out-of-sample R² to standard volatility models after spikes but shows no edge on daily bars.

Fanfare 3Derivatives & VolatilityJeremia Passmore

22

Corporate Bond Spread Decomposition in Brazil

Decomposing debenture spreads into issuer, market, and contract components shows issuer risk explains 54 percent of variance, enabling out-of-sample pricing within 14 basis points.

Fanfare 3Derivatives & VolatilityGabriel Pires

27

Neural Option Pricing Hedging Diagnostics

The research separates pricing error from hedging loss by decomposing delta-hedge profit and loss into terminal mismatch, residuals, volatility misspecification, rebalancing, and trading costs.

Fanfare 2Derivatives & VolatilityFrancesco Demuro

Also notable2

11

Arrow-Debreu Prices in Polymarket Contracts

State prices from binary prediction markets on the Fed decision and presidential election satisfy the law of one price for complete contingent claims, with overround declining steadily toward resolution.

Fanfare 3Macro-Finance & RatesSimon-Pierre Boucher

16

Verifiable Standard for AI Market Forecasts

A transparency standard with cryptographic timestamping allows independent verification of AI forecasts before market opens, making backtests tamper-proof and comparable across models.

Fanfare 3Econometrics & ForecastingVadym Chernets

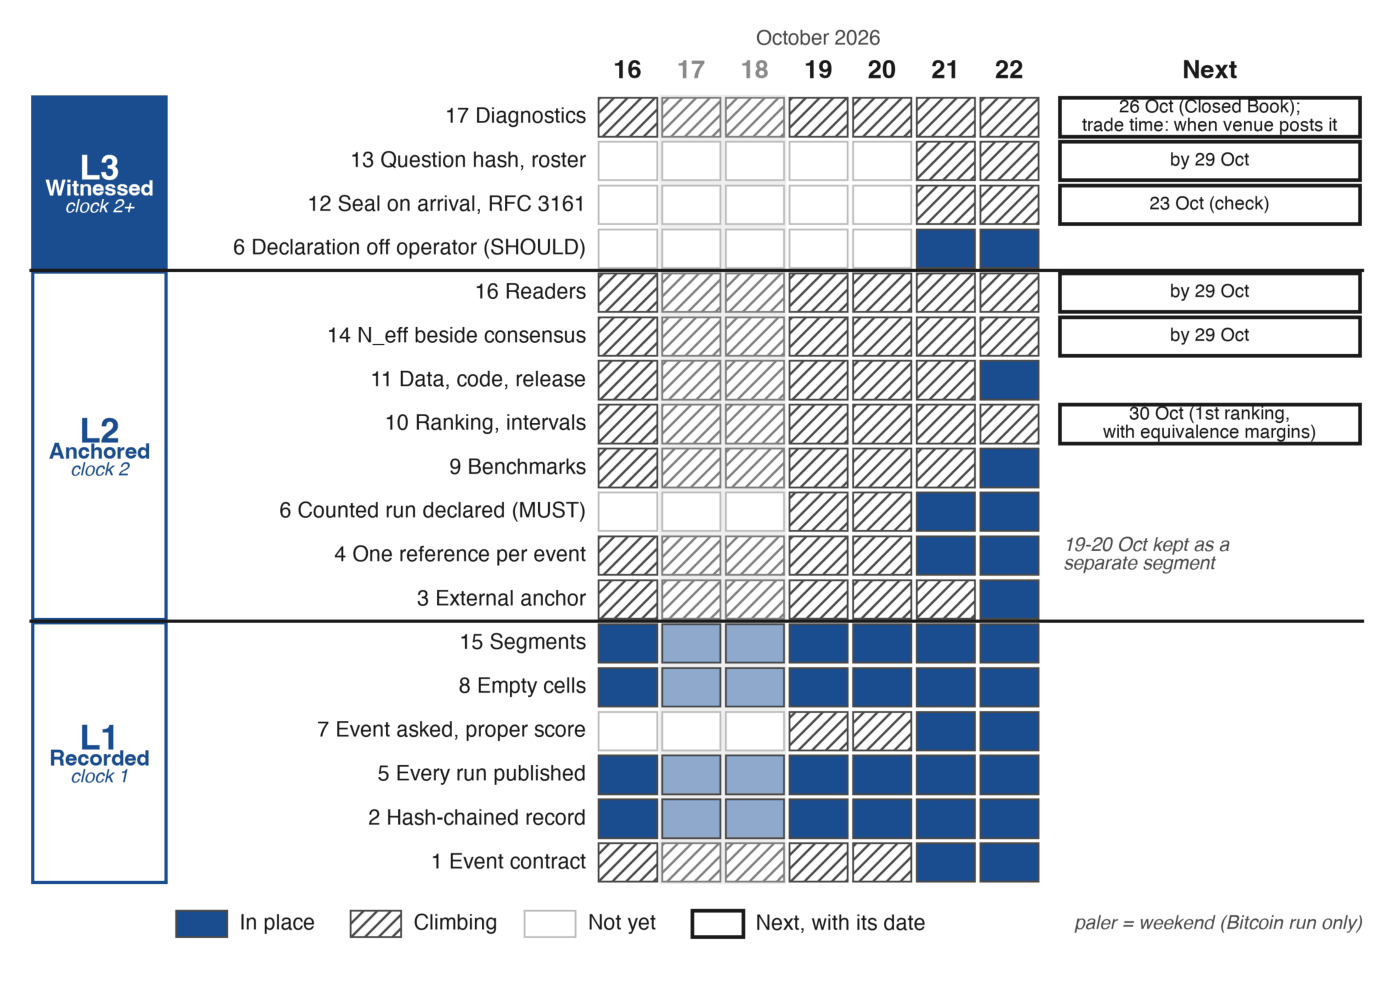
Compliance ladder timeline showing verification levels for AI forecasts from October through completion.
Figure 4. The league on the ladder of the standard, day by day.

RePEc

Working papers curated by RePEc's NEP field reports

30 papers · 21 figures

ML & AI Methods2

01

AI Productivity Gains Boost GDP Growth

Using stock market data to measure AI's effect on software engineering productivity, the study estimates AI raised expected productivity by 32.6% and GDP by 3.6% to 6.5% through end-2025.

Fanfare 4ML & AI MethodsAlex Blumenfeld et al.PDF

Software engineering payroll share vs
Figure 1: Software engineering payroll share vs. THNQ beta
07

LLMs as Intransitive Voting Mechanisms

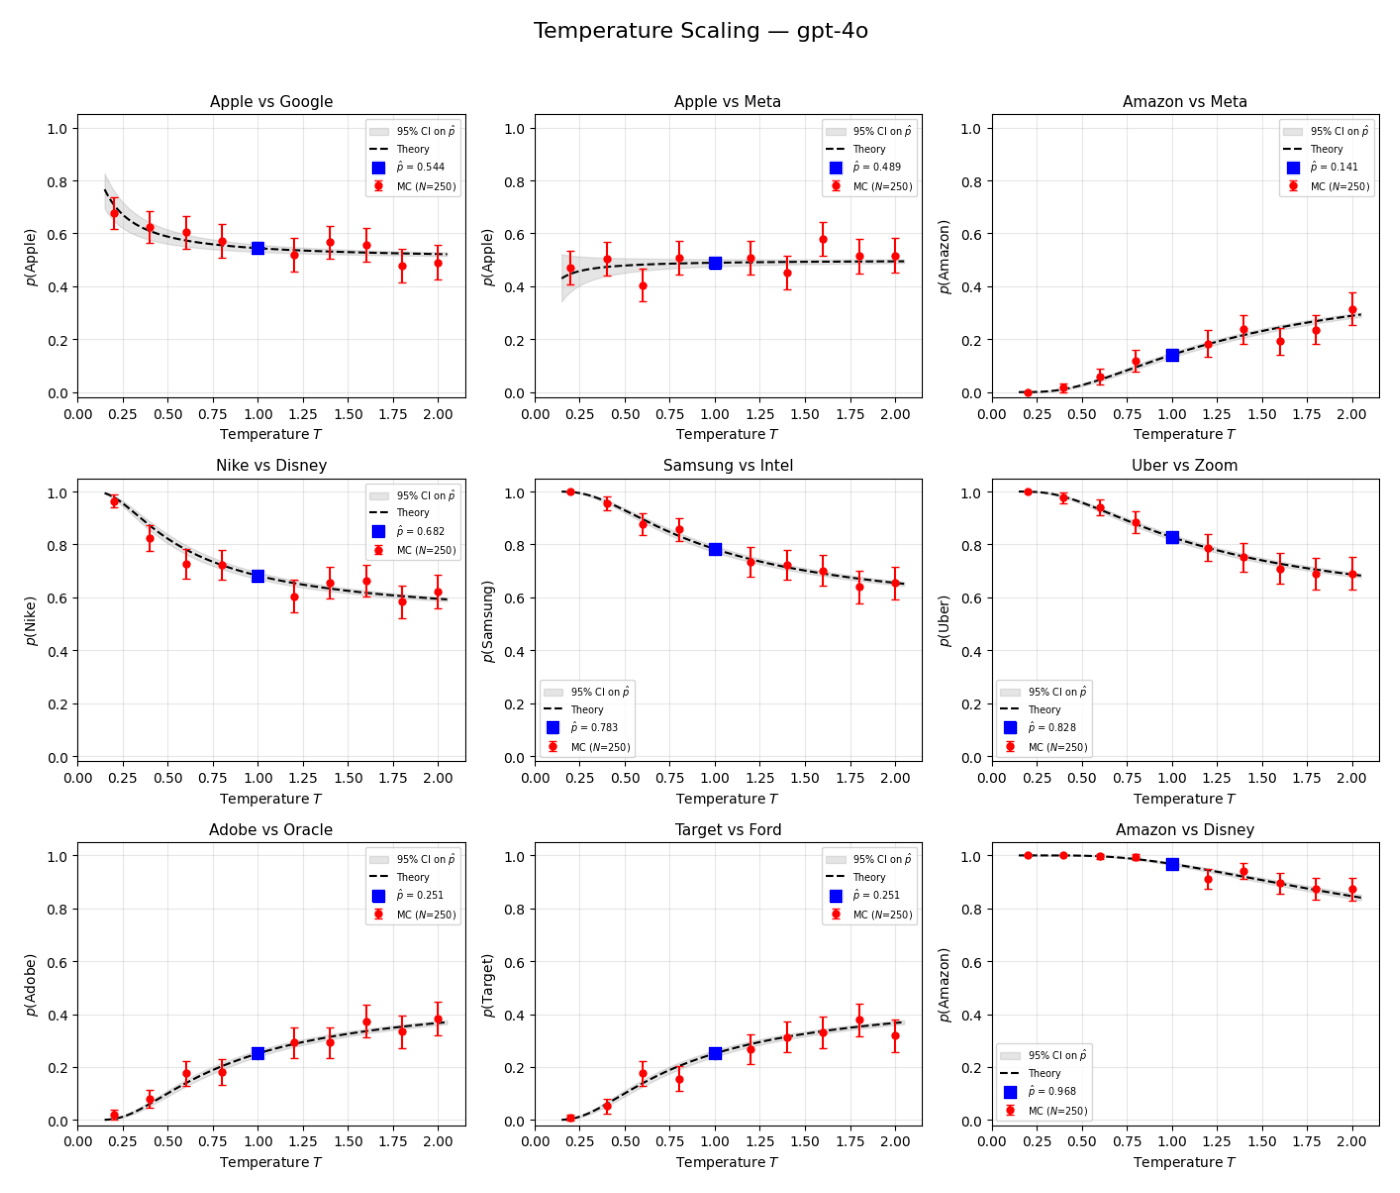
The study proves that large language models function as voting rules and identifies millions of Condorcet cycles in ChatGPT investment recommendations, creating potential money-pump vulnerabilities.

Fanfare 3ML & AI MethodsRaša Karapandža and Yaw NyarkoPDF

Observed and predicted effects of temperature on ChatGPT-4o’s pairwise investment recommendations
Figure 2: Observed and predicted effects of temperature on ChatGPT-4o’s pairwise investment recommendations.

Asset Pricing & Factors6

02

Human Capital Concentration in Venture Capital

Over 100,000 VC professionals show extreme concentration: 5% generate 90% of profits, with superstar status increasing access to high-quality deal flow.

Fanfare 4Asset Pricing & FactorsBlake Jackson and Ilya A. StrebulaevPDF

Panel A displays the likelihood for whether a VC professional is included on the Midas list in a given year based on
Figure 7: Panel A displays the likelihood for whether a VC professional is included on the Midas list in a given year based on the predicted likelihood that the VC profe…
13

Shale Oil and U.S. Macroeconomic Shocks

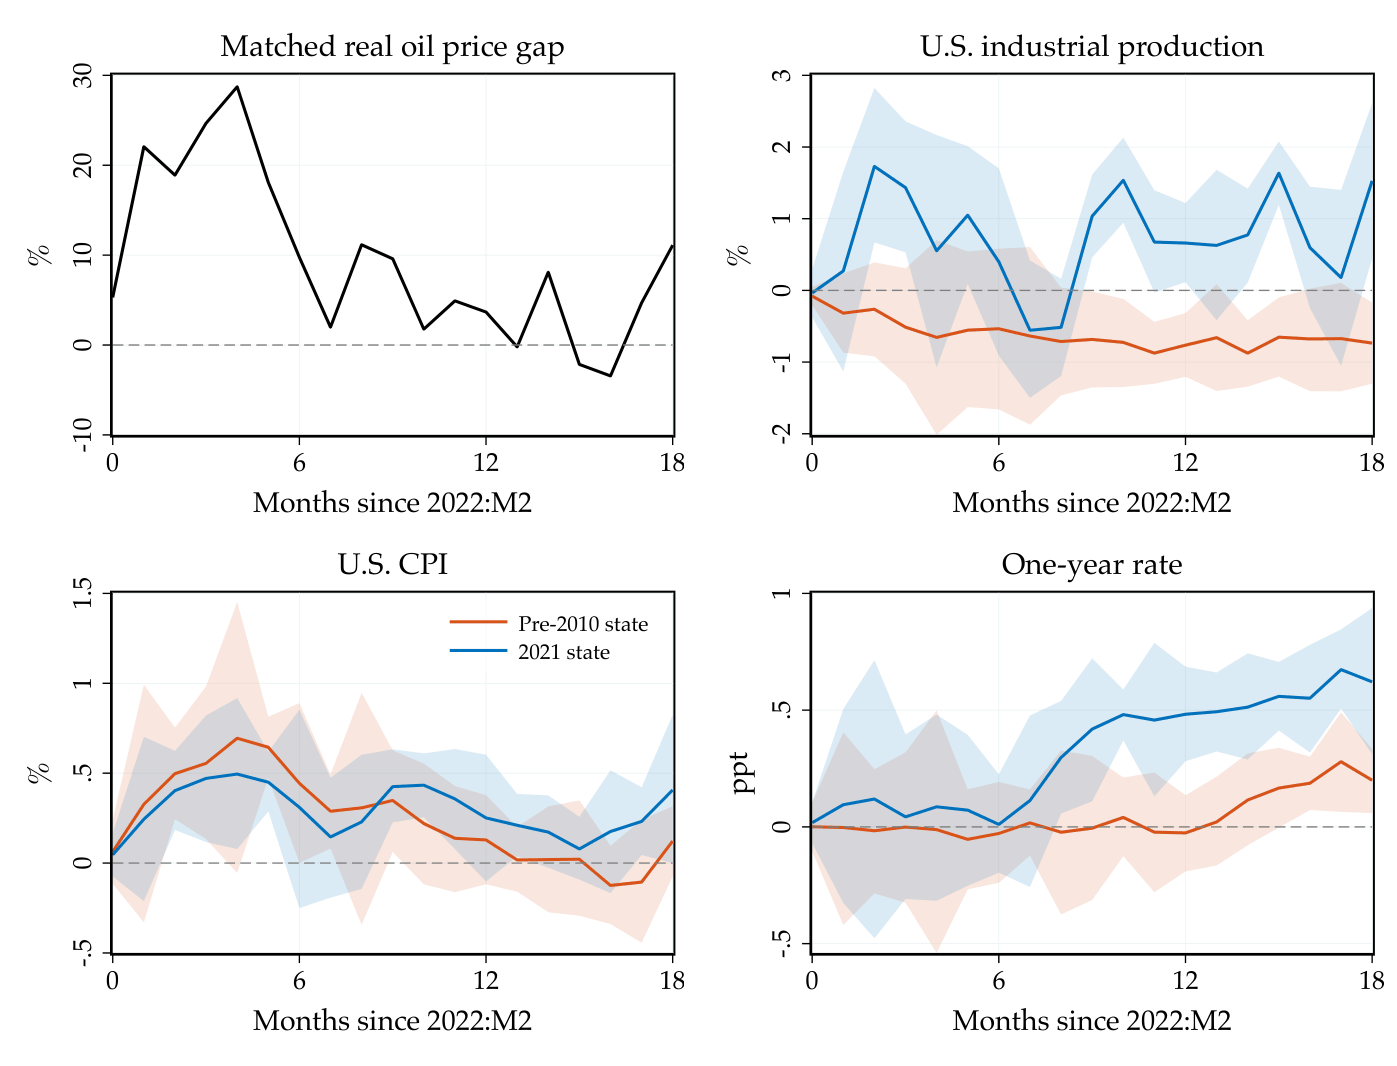
The shale revolution shifted how oil supply shocks affect the U.S. economy: contractionary effects weakened and became expansionary as the nation transitioned to net petroleum exporter.

Fanfare 3Asset Pricing & FactorsDiego R. Känzig et al.PDF

Oil price shock effects on U.S. industrial production, inflation, and interest rates comparing pre-2019 and 2021 scenarios.
Figure 17: The 2022 oil price increase under alternative U.S. petroleum trade positions
15

Inflation Narratives Drive Risk Premia

Inflation risk premia move inversely with demand-versus-supply narratives extracted from financial news, consistent with asset pricing theory across euro area and U.S. maturities.

Fanfare 3Asset Pricing & FactorsLuís Fonseca et al.PDF

16

Stock-Bond Correlations Shift in Euro Area

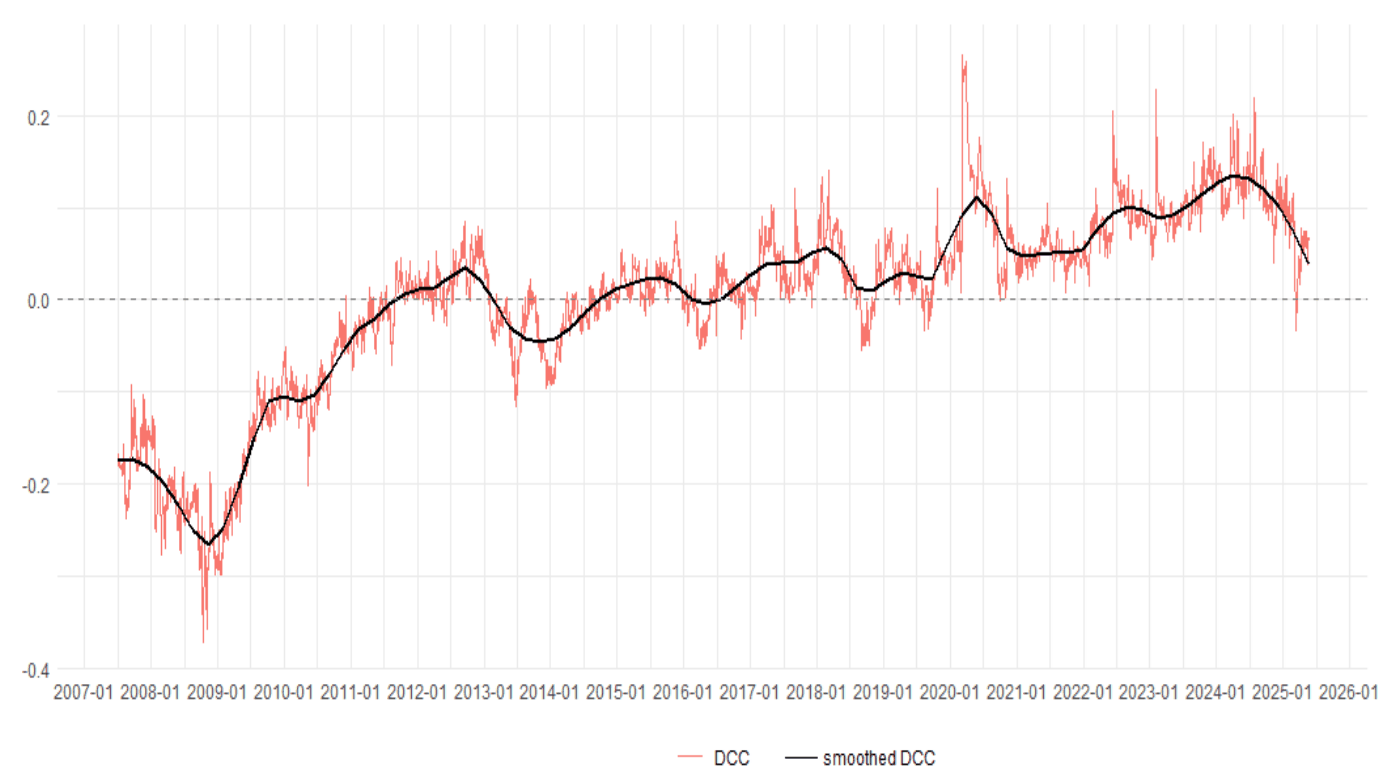
A matched-issuer study finds euro-area stock-bond correlations have trended toward zero since 2009, with discount rates driving co-movement but financial stress effects weakening in high-inflation periods.

Fanfare 2Asset Pricing & FactorsLinas Jurkšas and Julien IdierPDF

Daily mean correlations of stock-bond pairs trending toward zero since 2009
Figure 1. The daily mean correlations (DCCs) of price changes across all NFC CAC40 stock- corporate bond pairs
18

New Keynesian Model of Term Structures

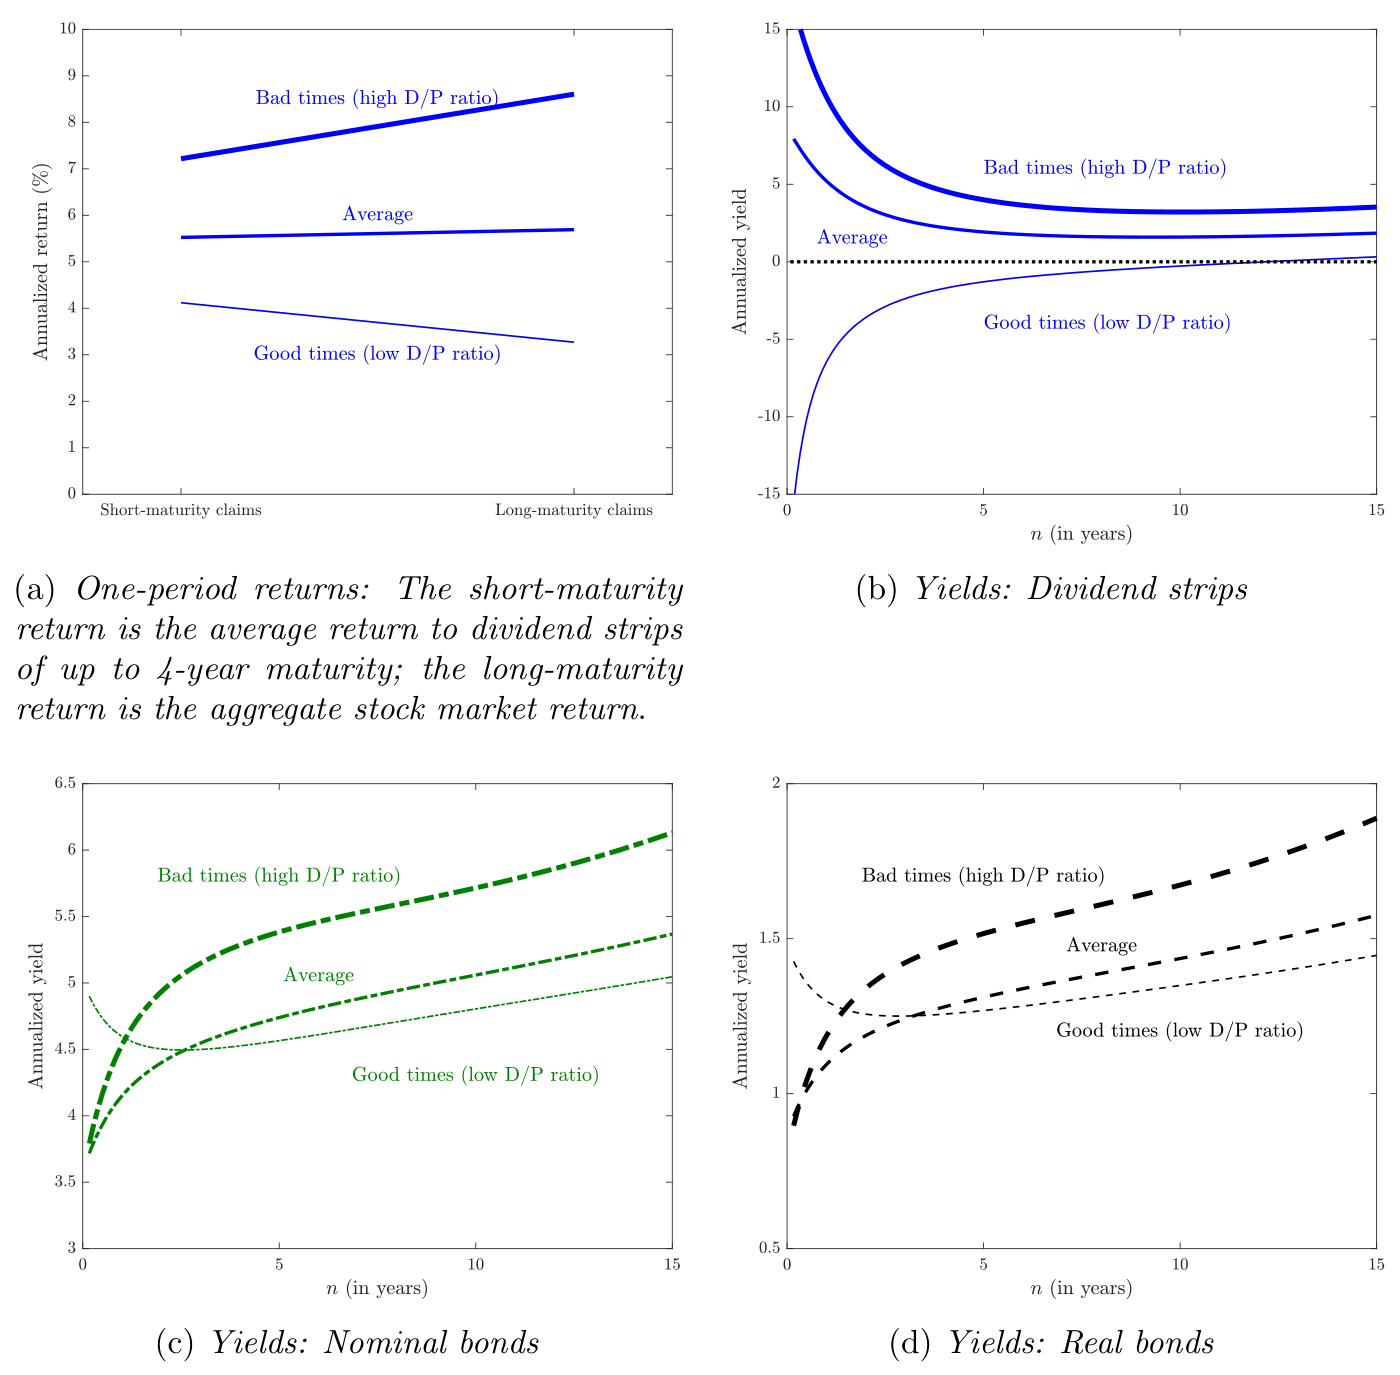
A production economy with sticky prices explains equity and bond term structure slopes and cyclicality through countercyclical inflation and habit-driven risk premiums.

Fanfare 2Asset Pricing & FactorsPierlauro Lopez et al.PDF

Time variation of the term structures of one-period returns and yields
Figure 3: Time variation of the term structures of one-period returns and yields. Bad (good) times are periods in which the aggregate price-dividend ratio is below (abov…
21

Causes of the 2000s Housing Cycle

A synthesis of two decades of research attributes the housing boom to improved fundamentals, credit expansion, rate declines, and shifting expectations, with defaults driving the bust.

Fanfare 2Asset Pricing & FactorsAdam GurenPDF

Econometrics & Forecasting5

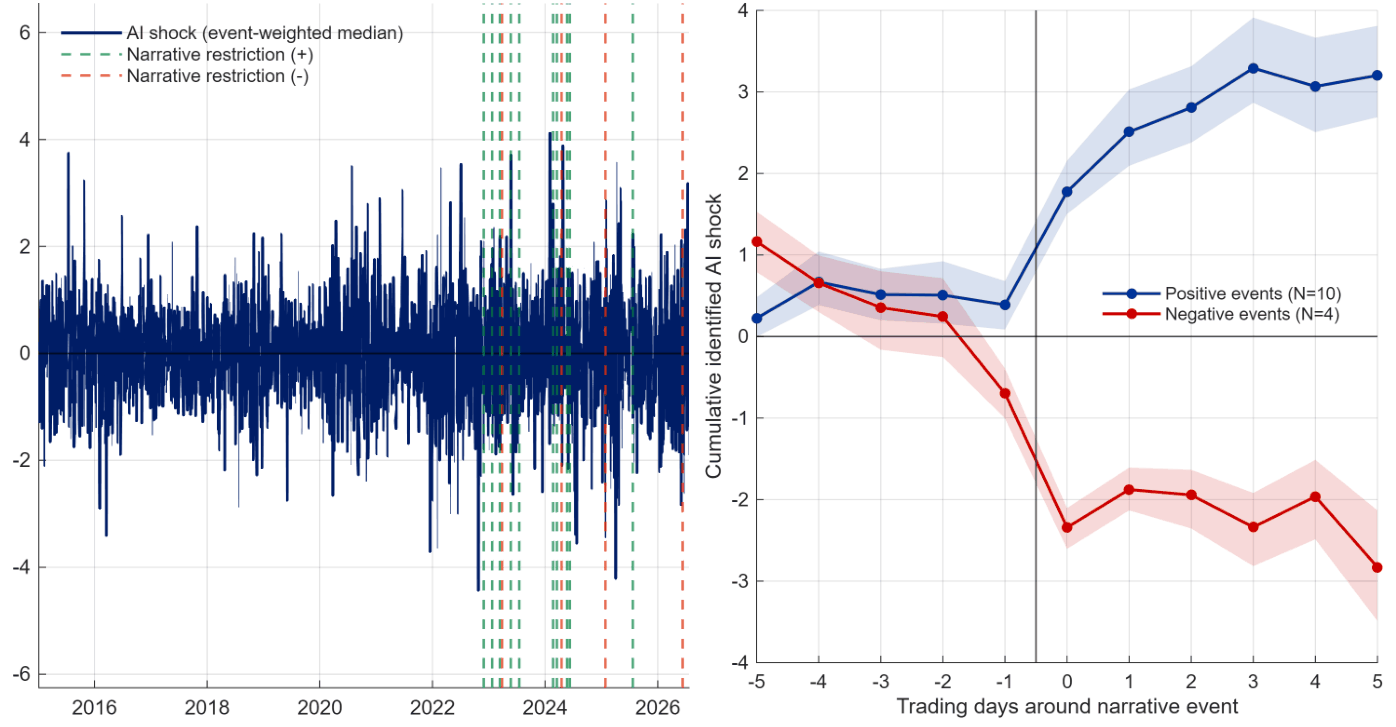
03

AI News Shocks Spark Investment Cycles

The research identifies AI news shocks from equity factors and shows they trigger investment-led US growth but create monetary dilemmas via imported inflation in the euro area.

Fanfare 3Econometrics & ForecastingMaria Sole PagliariPDF

Daily AI news shocks over time with cumulative effects around major narrative events
Figure 3 (a) Daily AI news shocks with major events (b) Cumulative shocks around narrative events
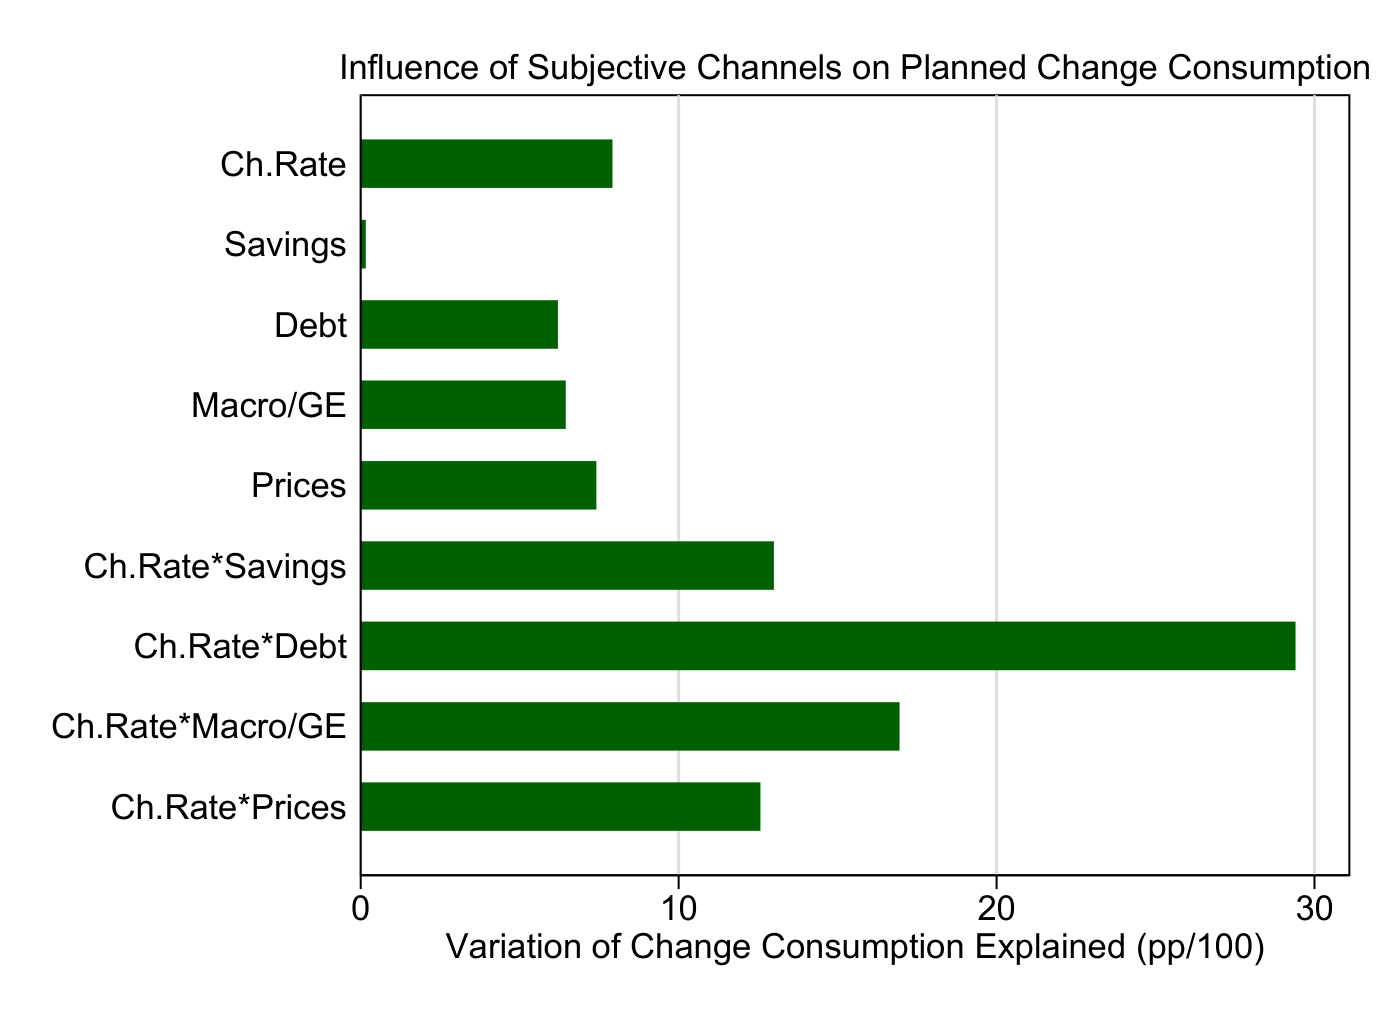
09

Subjective Models Shape Monetary Policy Transmission

Evidence from a multi-country survey shows that heterogeneous beliefs about how monetary policy works significantly alter households' consumption responses to rate changes.

Fanfare 3Econometrics & ForecastingFrancesco D’Acunto et al.PDF

Bar chart showing subjective channels' influence on consumption changes by interaction type.
Figure 5: Explained Variation of Change in Consumption by Subjective Models: Boosted Regression Trees
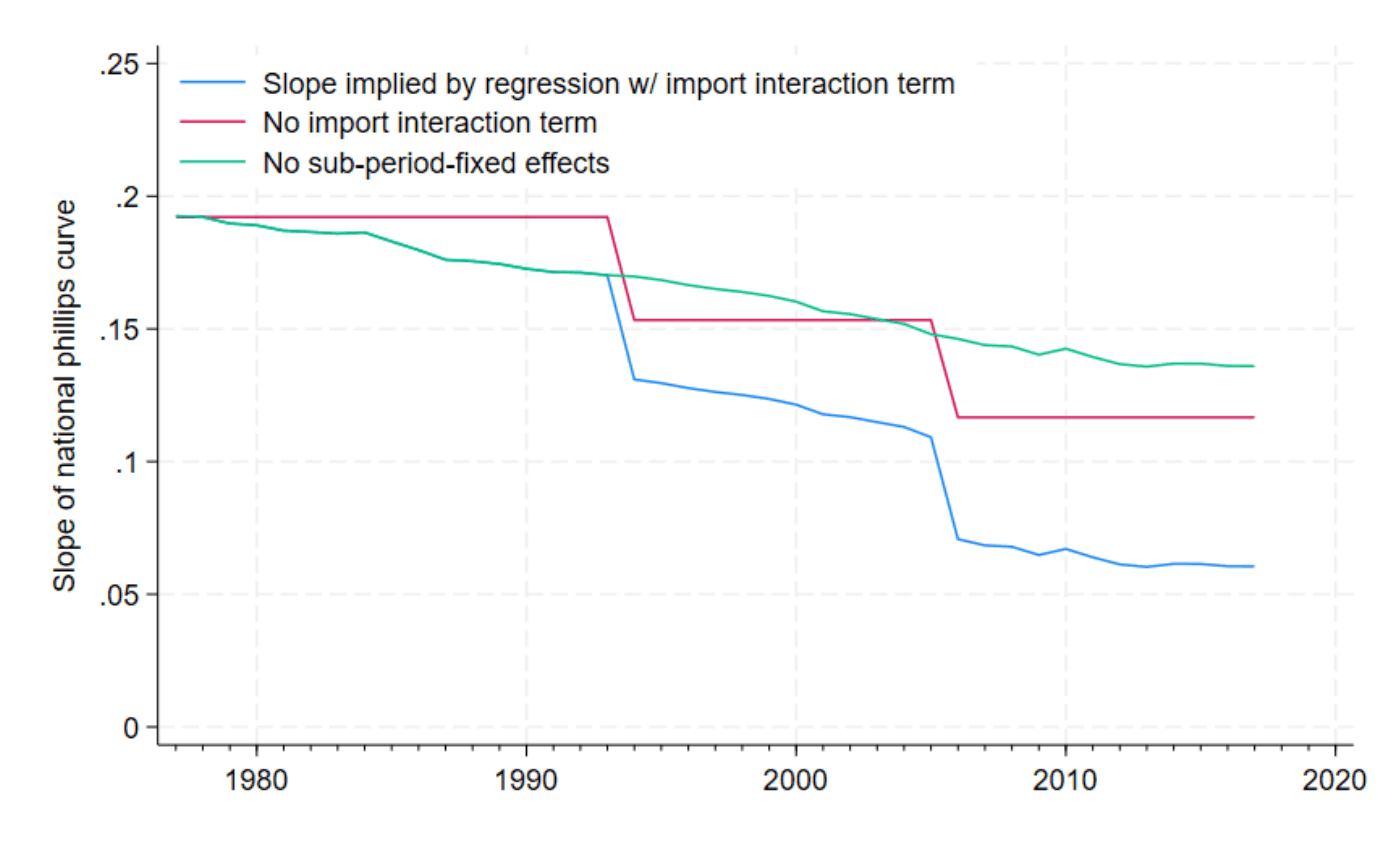
12

Globalization Flattens the Phillips Curve

Research finds that rising import exposure accounts for roughly 40 percent of U.S. Phillips curve flattening since 1976, with major implications for monetary policy trade-offs.

Fanfare 3Econometrics & ForecastingColin J. Hottman and Ricardo M. Reyes-HerolesPDF

Phillips curve slope decline over time, showing import interaction term effect
Figure 4: Evolution of the National Phillips Curve Slope Coefficient
26

Features of Bayesian Nowcasting Models

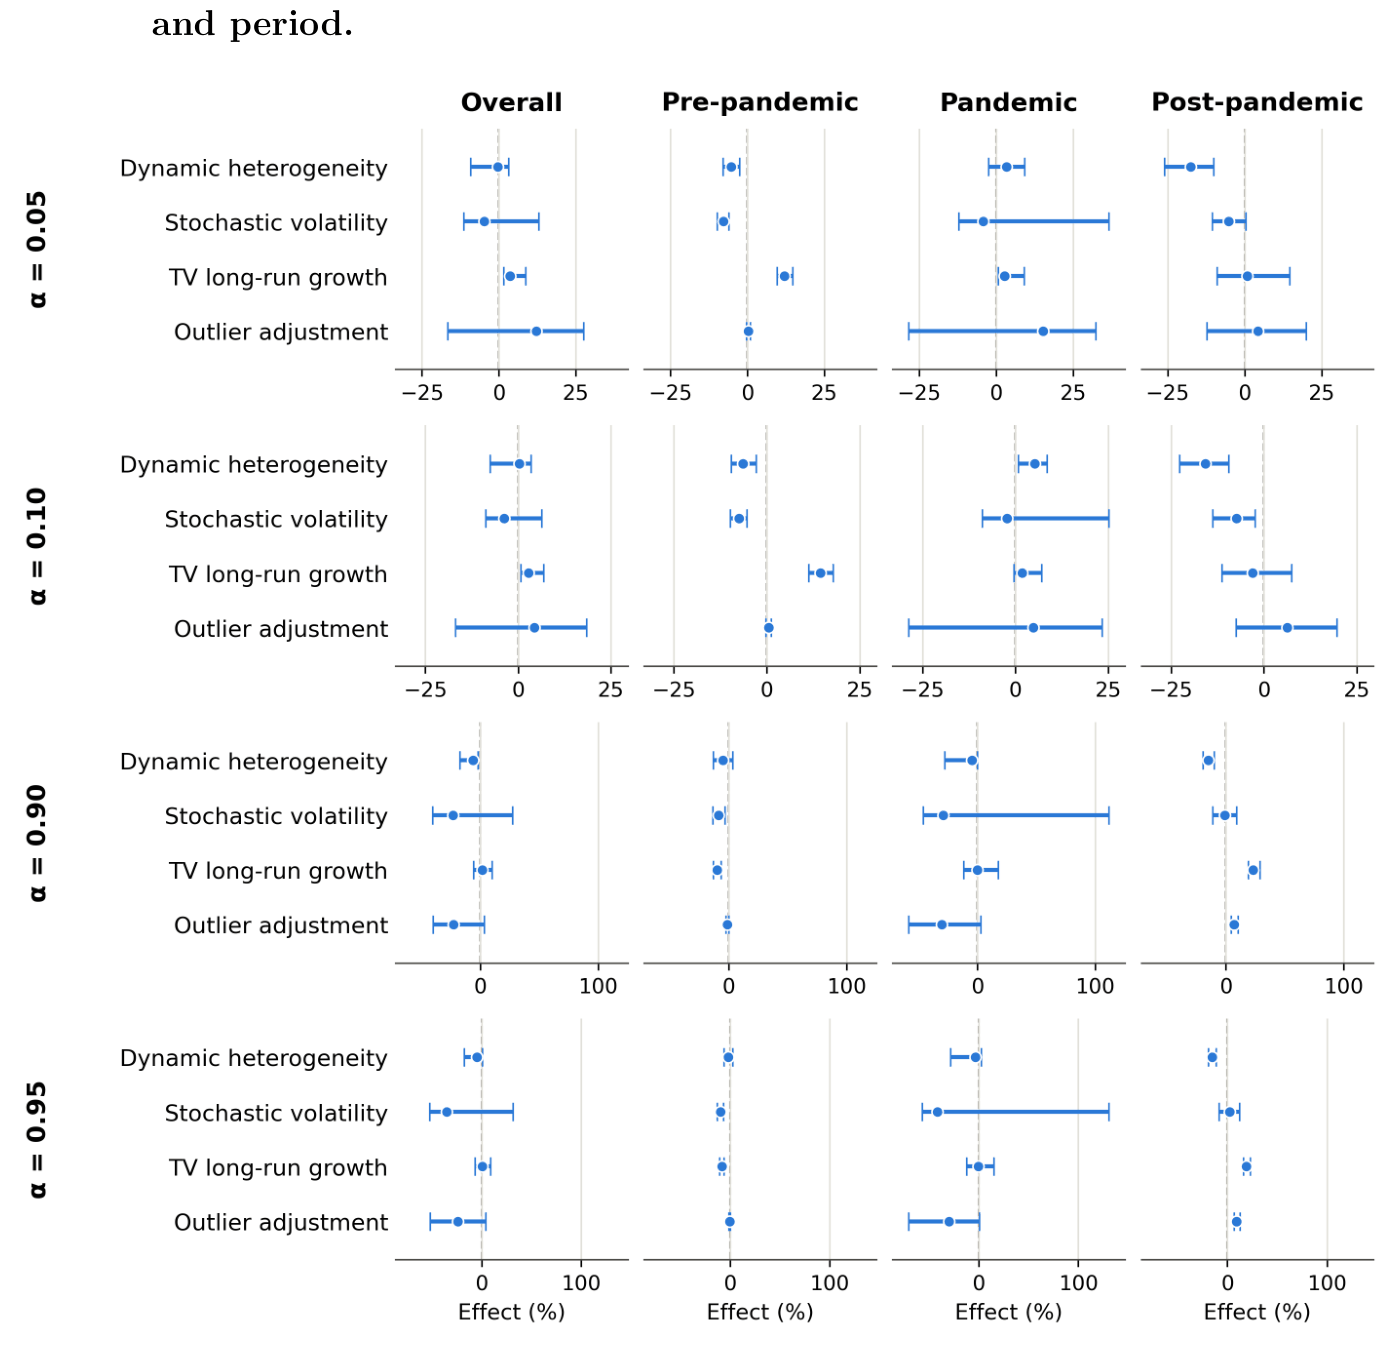
Testing eight model features on US GDP forecasts, the study finds dynamic heterogeneity consistently improves point, density, and tail forecasts while other features help selectively.

Fanfare 2Econometrics & ForecastingFreddy García-Albán and Manuel González-AstudilloPDF

Balanced paired factorial contrasts for quantile scores, by quantile level
Figure 3: Balanced paired factorial contrasts for quantile scores, by quantile level
27

Trade War Spillovers Through Production Networks

A tariff war model shows asymmetric impacts, with the imposing country bearing inflationary burden and the target experiencing larger output contraction via production network propagation.

Fanfare 2Econometrics & ForecastingPablo Aguilar et al.PDF

Risk, Credit & Banking5

04

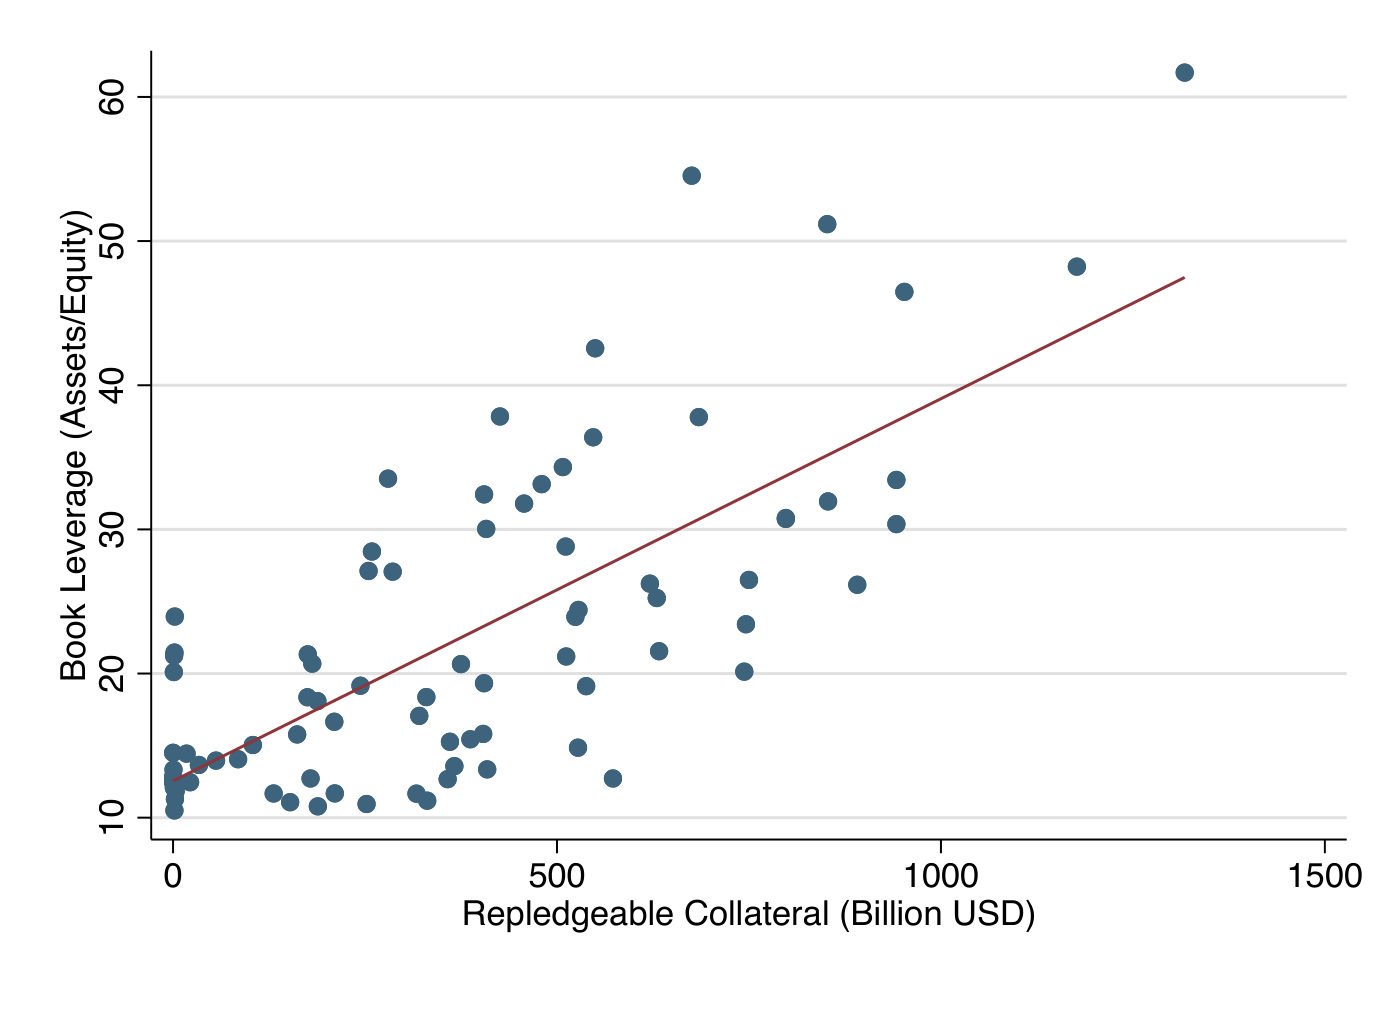
Collateral Rights and Financial Runs

The paper shows that strengthening collateral pledgeability can paradoxically fuel leverage and instability, confirmed by exploiting the 2005 bankruptcy reform's expansion of repo safe harbors.

Fanfare 3Risk, Credit & BankingHusnu C. Dalgic et al.PDF

Scatter plot showing positive relationship between repledgeable collateral and dealer leverage with trend line.
Figure 1. Dealer leverage and repledgeable collateral
24

Interest Coverage Covenants and Firm Value

A capital structure model shows that interest coverage ratio covenants can improve firm value by reducing default costs, though they constrain shareholder discretion.

Fanfare 2Risk, Credit & BankingMichi Nishihara et al.PDF

28

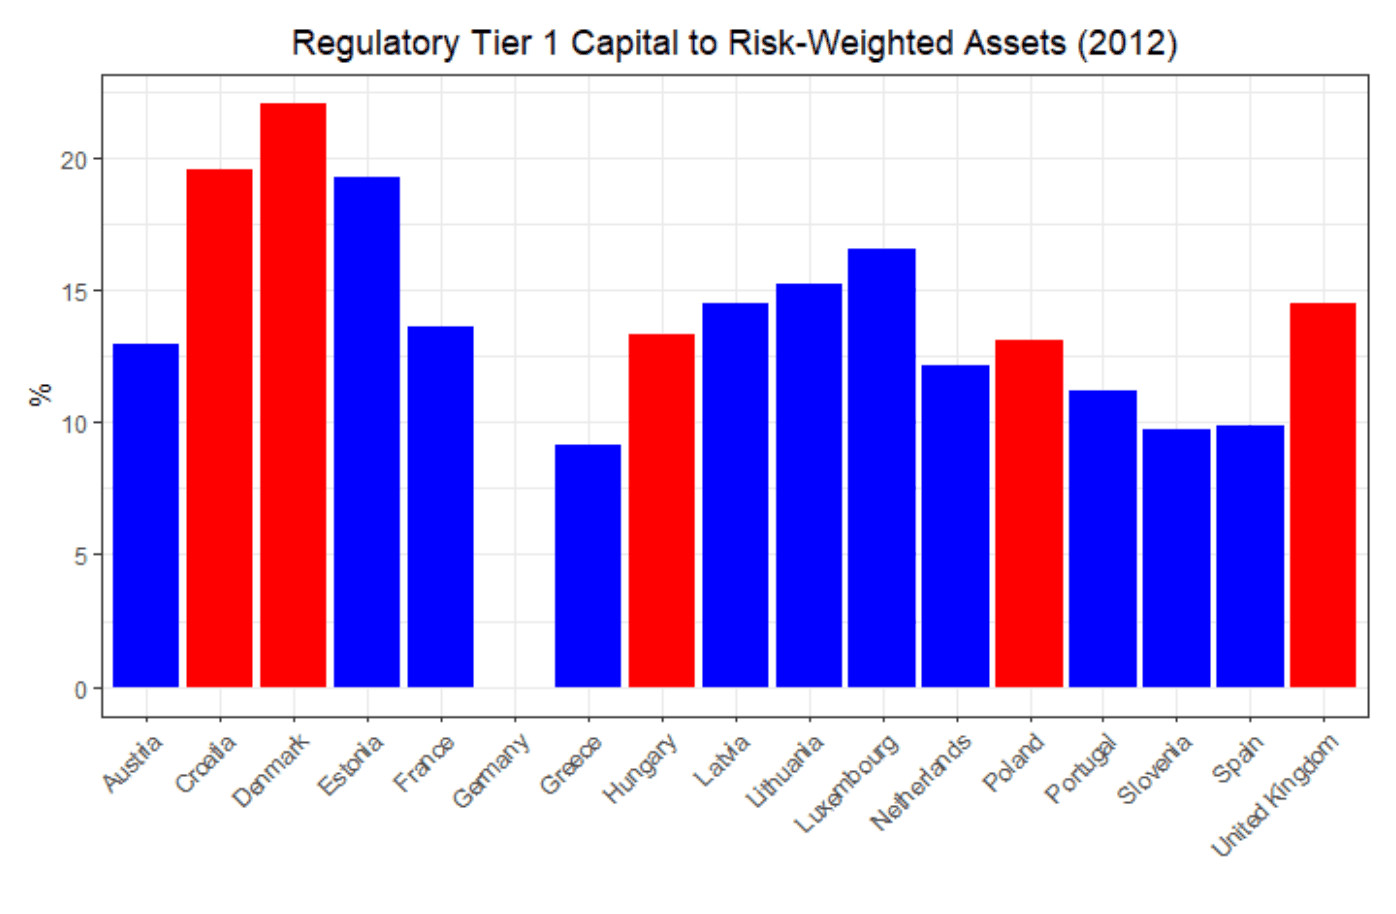
Supranational Supervision and Firm Investment

European single supervisory mechanism adoption caused firms to reduce intangible asset shares due to tighter lending and higher collateral standards, especially for small firms.

Fanfare 2Risk, Credit & BankingMiguel Ampudia et al.PDF

Tier 1 regulatory capital, by country
Figure 3. Tier 1 regulatory capital, by country
29

Dodd-Frank and M&A Activity

Increased credit rating agency scrutiny under Dodd-Frank reduced speculative-grade firms' acquisitions, leading to more selective deals and higher announcement returns.

Fanfare 2Risk, Credit & BankingAnup Basnet et al.PDF

30

Uncertainty and Sovereign Debt Equilibria

The paper characterizes how fiscal uncertainty shrinks the range of multiple equilibria in sovereign debt markets, eventually yielding unique interest rates as uncertainty grows.

Fanfare 2Risk, Credit & BankingOlivier J. Blanchard et al.PDF

Portfolio & Allocation3

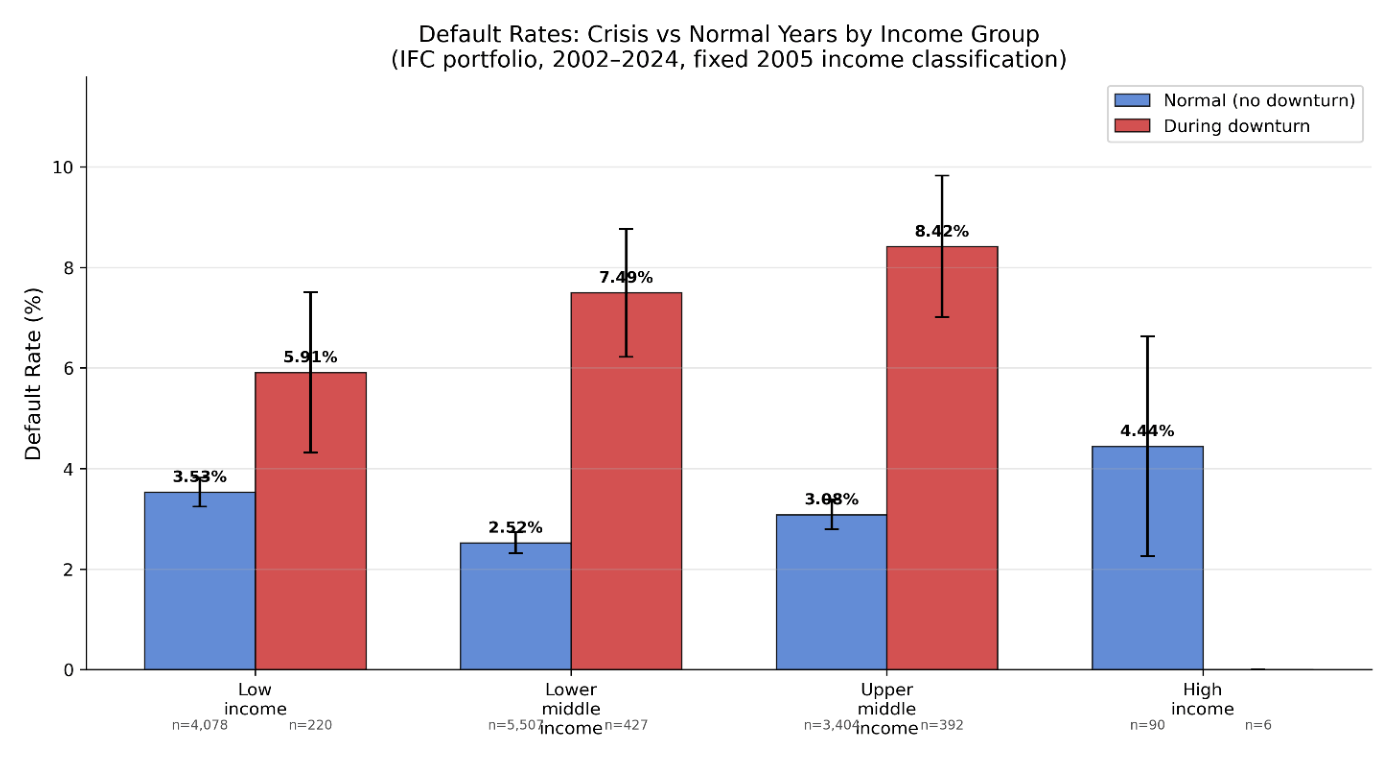
06

Private Debt Returns in Emerging Markets

Analysis of 4,109 loans totaling $115 billion reveals that post-crisis private debt in emerging economies outperforms both emerging-market bonds and Treasuries with public market equivalents above 1.02.

Fanfare 3Portfolio & AllocationShawn Cole et al.PDF

Default rates: Crisis versus Normal by Income Group
Figure 3: Default rates: Crisis versus Normal by Income Group
11

Financing AI Data Center Buildout

Estimates show a 188 GW U.S. AI campus buildout requires nearly $9 trillion through 2032, shifting toward leases, joint ventures, and structures that raise leverage and opacity.

Fanfare 3Portfolio & AllocationStijn Van NieuwerburghPDF

25

Private Equity Fund Manager Disclosures

The study finds that early textual discussions of portfolio companies better predict ultimate performance, while interim valuations matter more later, signaling general partner quality.

Fanfare 2Portfolio & AllocationJosh Lerner et al.PDF

Trading, Microstructure & Execution4

08

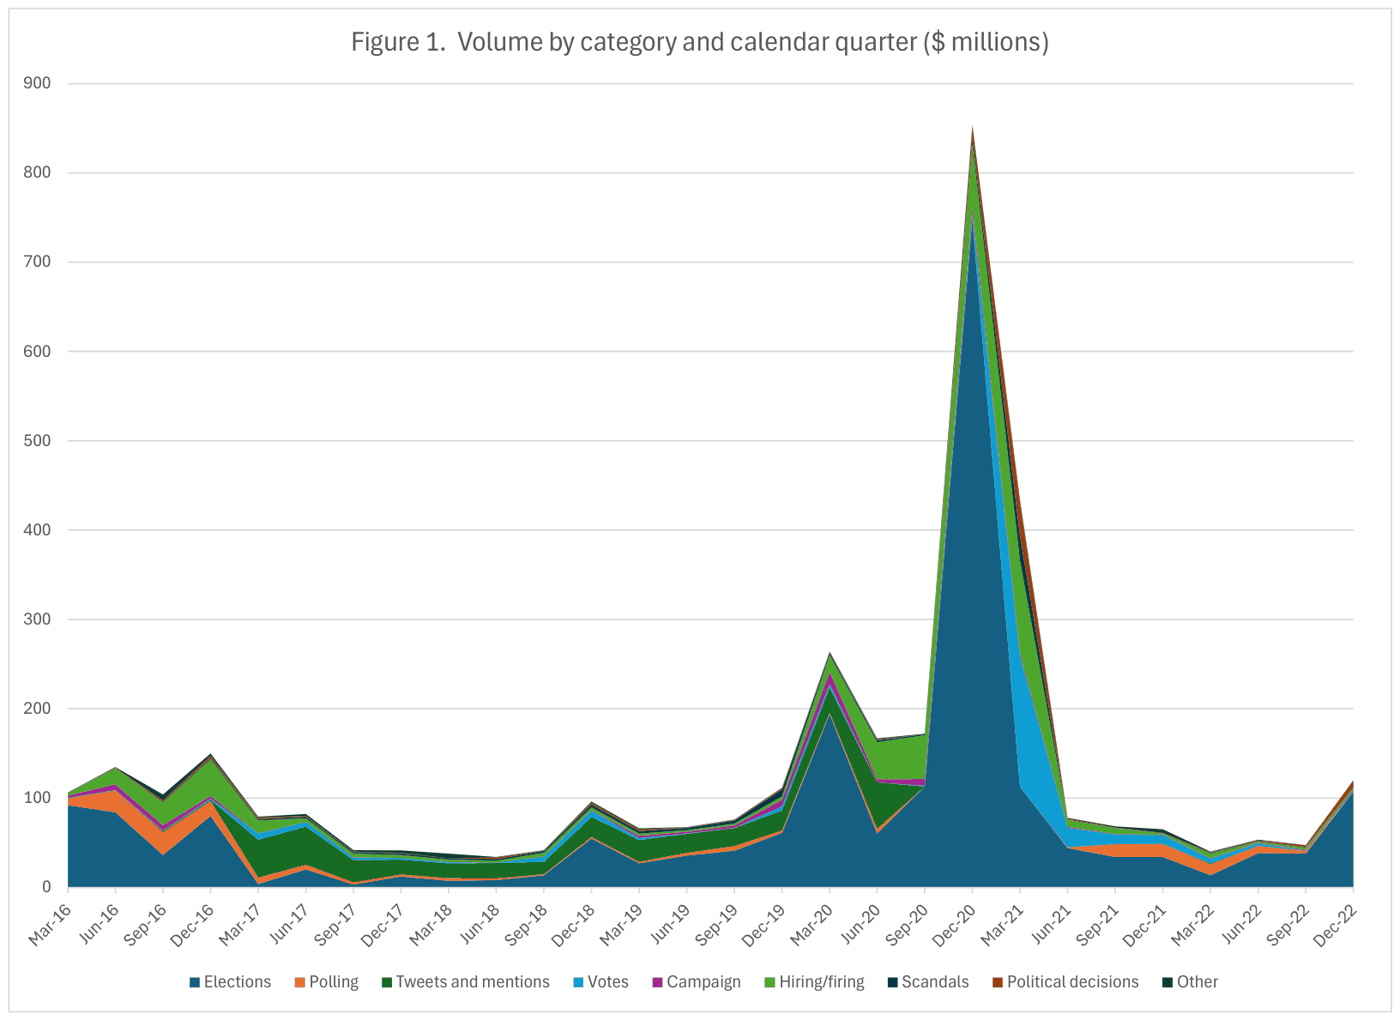
Position Limits and Prediction Market Efficiency

Analysis of PredictIt shows that limiting investor stakes to $850 per contract undermines price accuracy, with bid prices persistently implying arbitrage profits even after fees.

Fanfare 3Trading, Microstructure & ExecutionEric ZitzewitzPDF

Stacked area chart showing prediction market volume by category over time with peak in middle quarter.
17

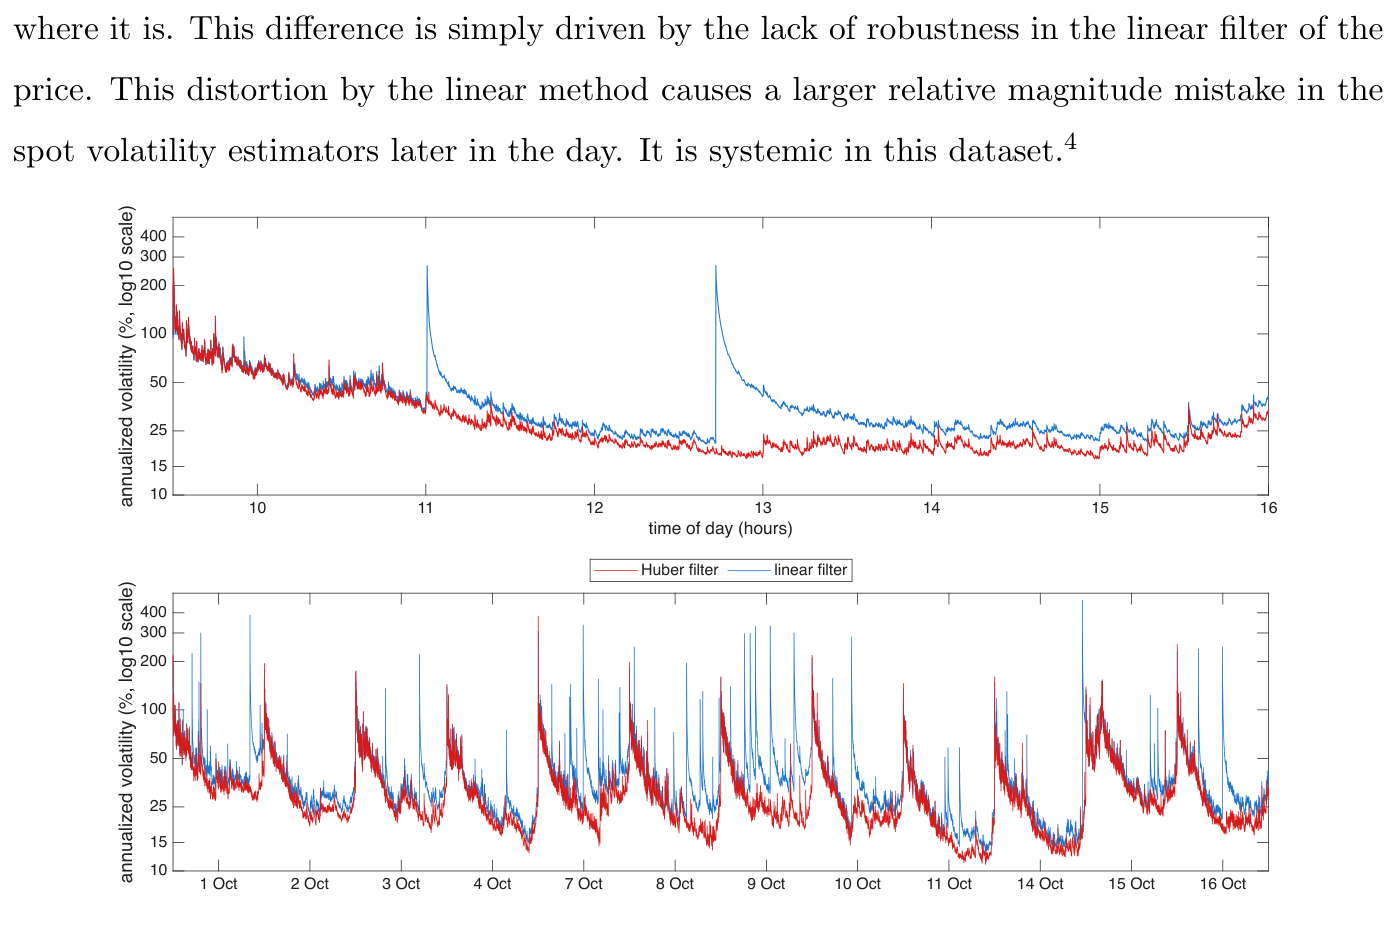
Non-Recursive Filtering for Microstructure Noise

A new parallel filter removes price microstructure noise from high-frequency trade data without bias, producing flat volatility signatures down to one-second frequencies.

Fanfare 2Trading, Microstructure & ExecutionSimon Donker van Heel and Neil ShephardPDF

Filtered spot volatility for NVDA over 12 trading days in Oct 2024 (19.6M trades), the diurnally adjusted estimator
Figure 11: Filtered spot volatility for NVDA over 12 trading days in Oct 2024 (19.6M trades), the diurnally adjusted estimator ˆσ(u)100
20

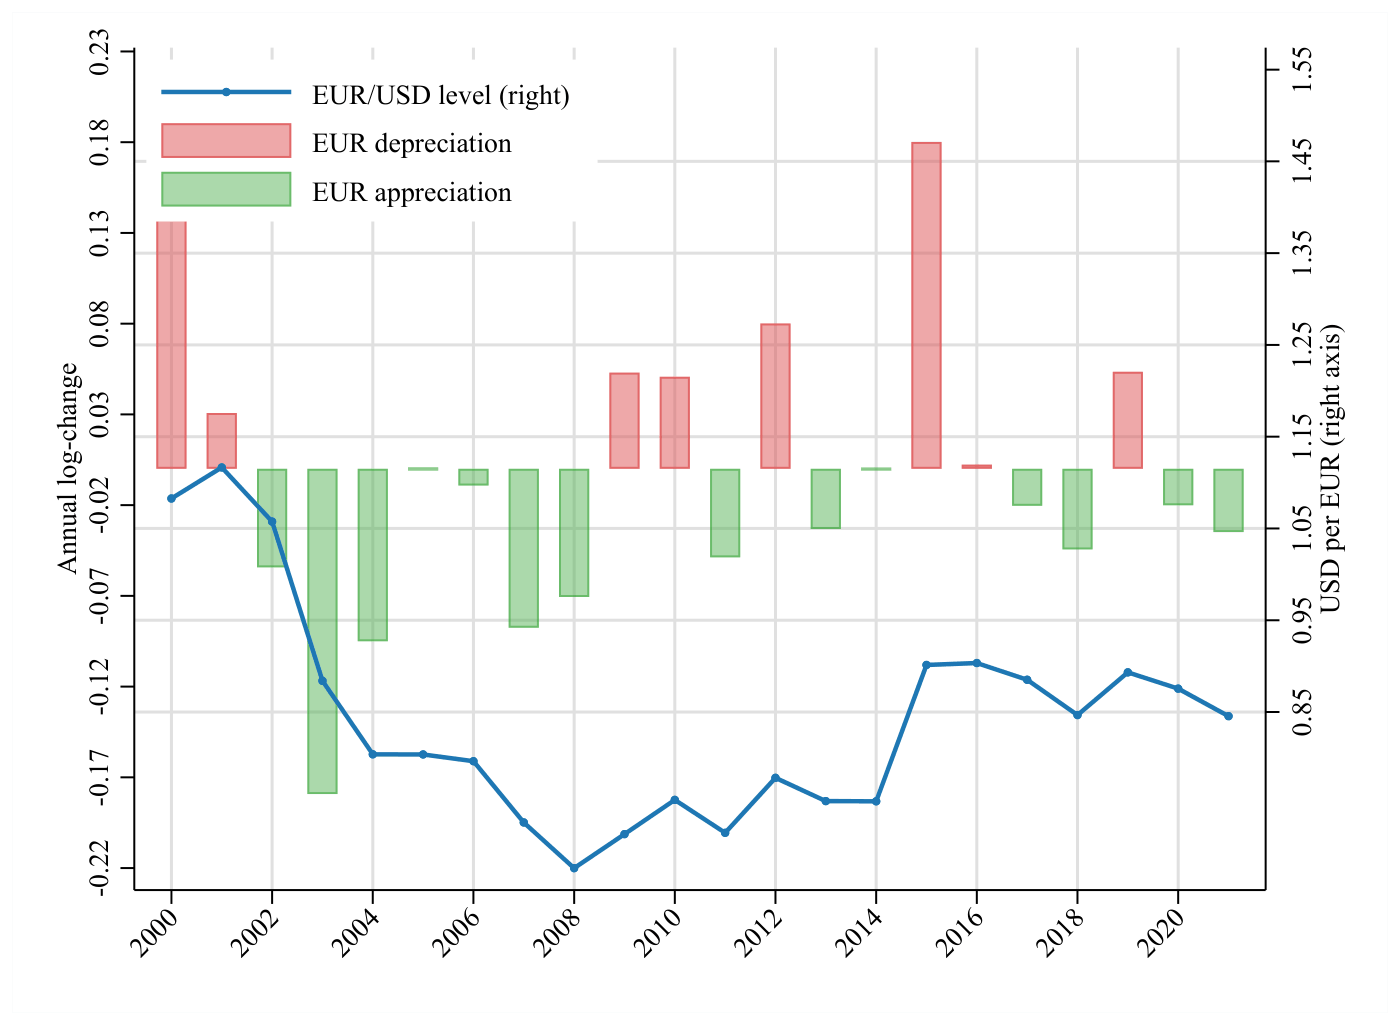
Invoicing Currency and Country Risk Hedging

Italian customs data shows firms match import and export invoicing currencies by country to reduce profit volatility from exchange-rate movements in real transactions.

Fanfare 2Trading, Microstructure & ExecutionEmanuele Brancati et al.PDF

Annual EUR/USD Exchange Rate
Figure B1: Annual EUR/USD Exchange Rate
23

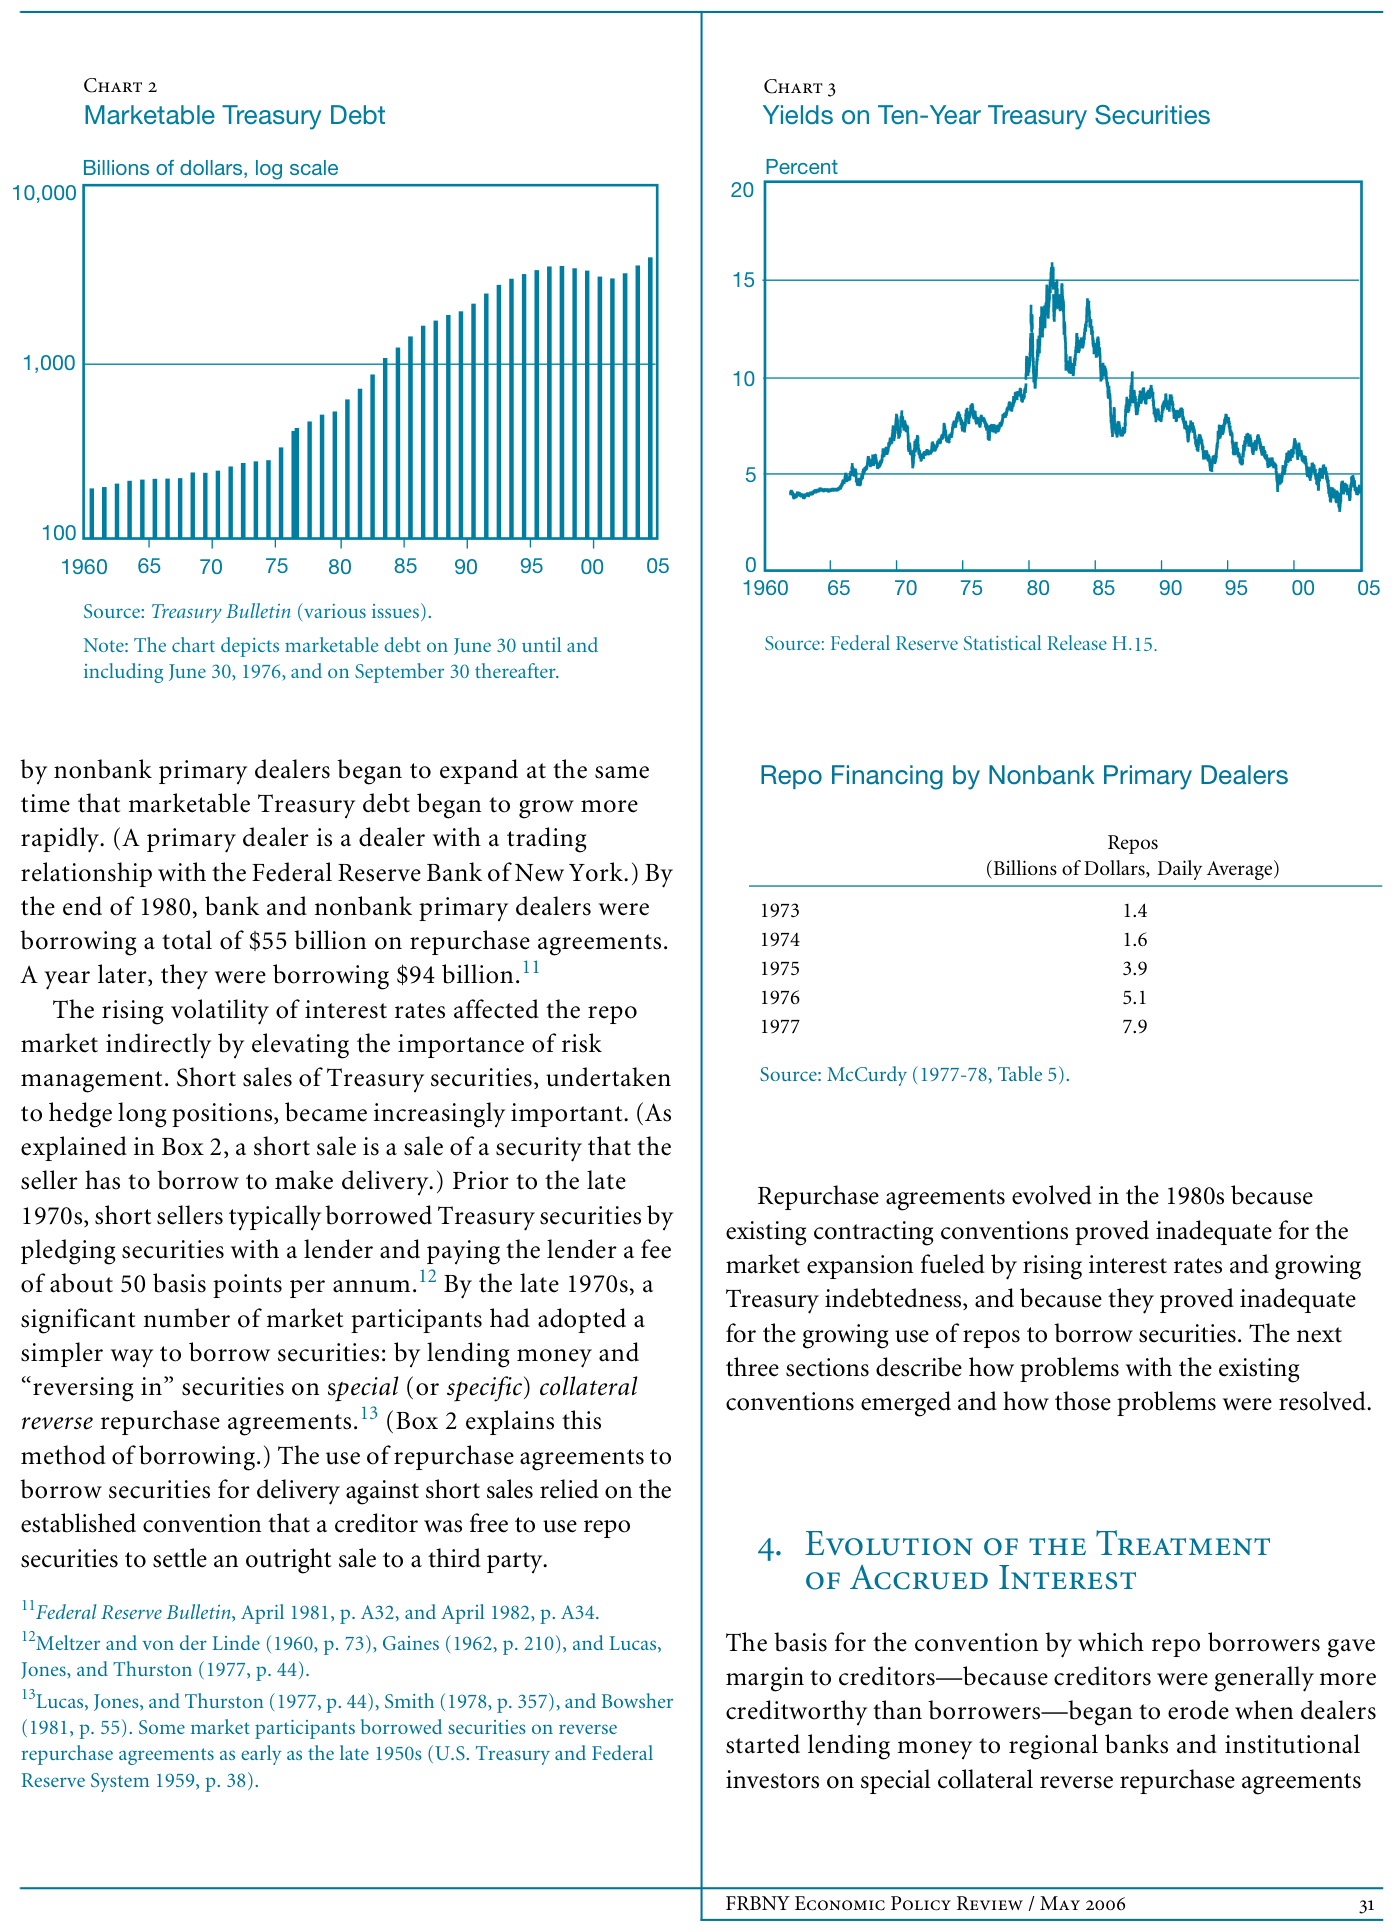
Repo Market Participants

The research examines who participates in U.S. repo markets, the trade-offs influencing repo segment structure, and the implications for monetary policy transmission.

Fanfare 2Trading, Microstructure & ExecutionGara Afonso et al.PDF

Time series charts showing repo market participation growth and yield trends over time

Macro-Finance & Rates3

10

Financial Innovation and Currency Dominance

Dollar-backed payment stablecoins and tokenization likely reinforce dollar dominance despite reducing transaction frictions, with multipolarity potentially increasing fragility.

Fanfare 3Macro-Finance & RatesGordon Y. Liao et al.PDF

14

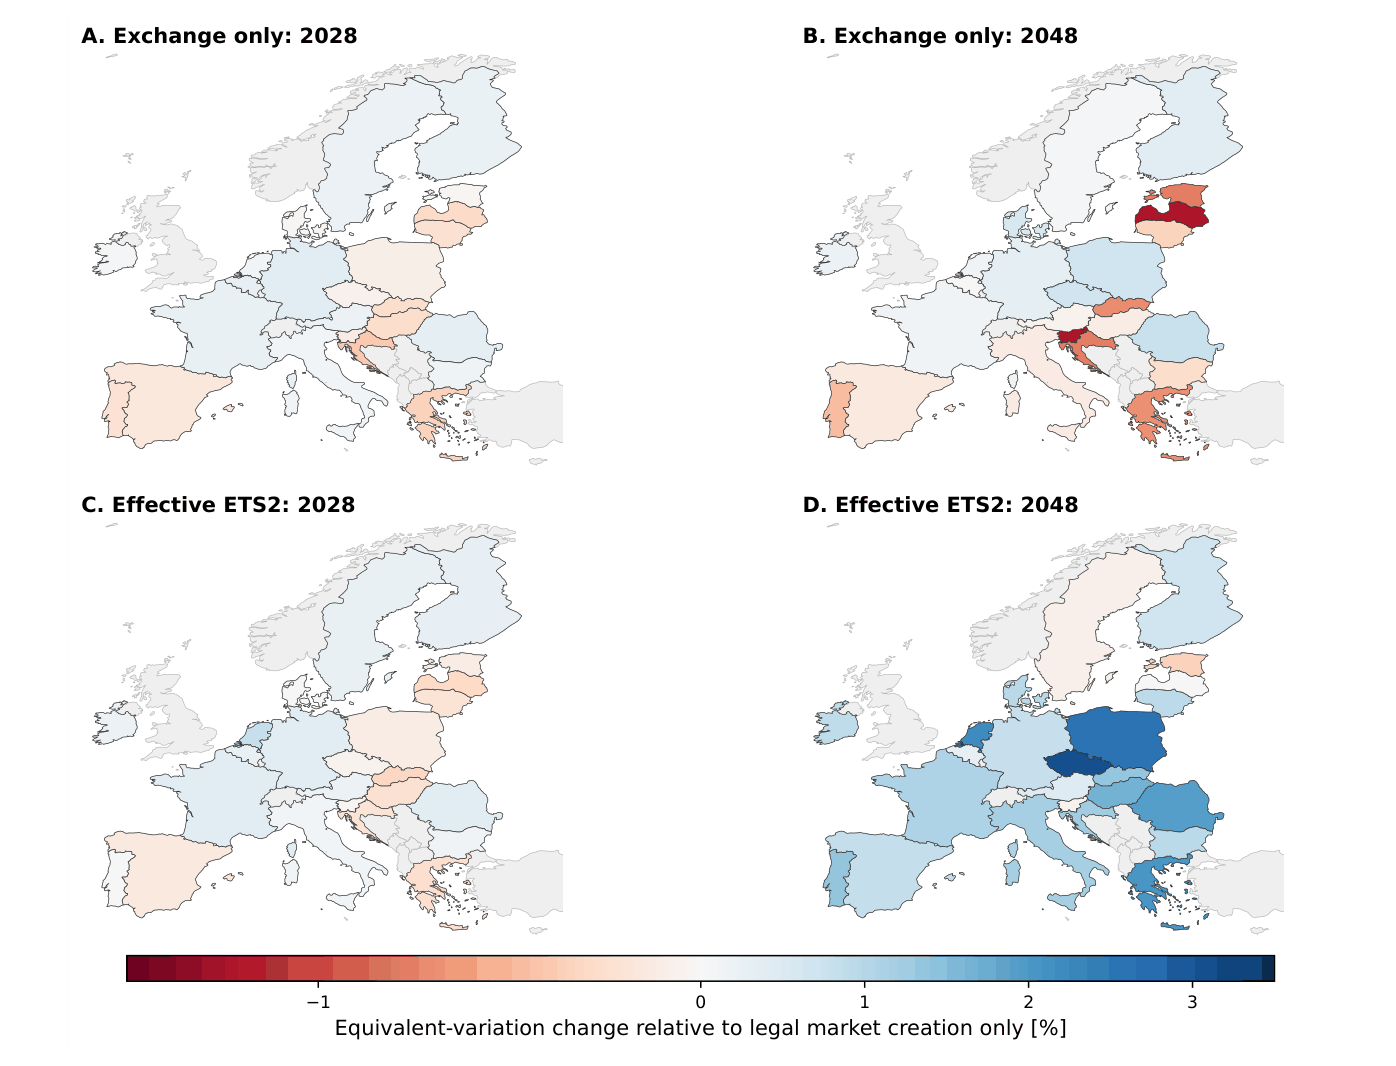
Emissions Trading System Design Costs

Completing exchange and allocation authority in the EU's carbon market ETS2 cuts present-value policy costs by EUR 1.33 trillion over 2028-2048 versus partial market creation.

Fanfare 3Macro-Finance & RatesJan Abrell and Sebastian RauschPDF

Country incidence of market completion
Figure 8. Country incidence of market completion
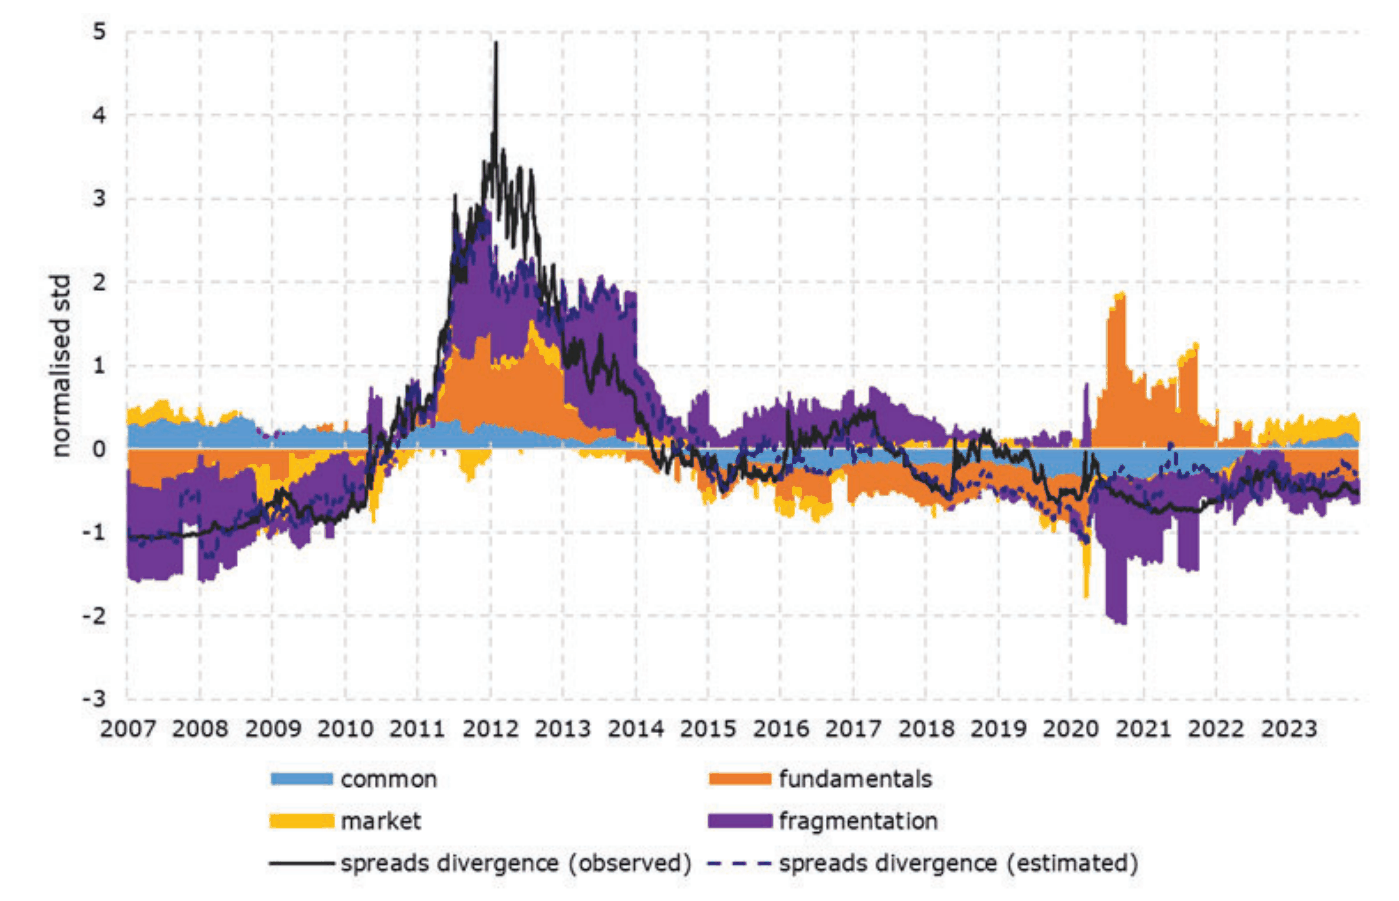
19

Measuring Sovereign Fragmentation in Euro Area

Research develops a high-frequency fragmentation index decomposing euro-area sovereign yields into common, market-driven, and fundamental components, showing Transmission Protection Instrument effectiveness.

Fanfare 2Macro-Finance & RatesAlicia AguilarPDF

Stacked area chart decomposing euro sovereign yield spreads into common, market, and fundamental factors over time.
Figure 5: Decomposition of euro area sovereign yields divergence

Also notable2

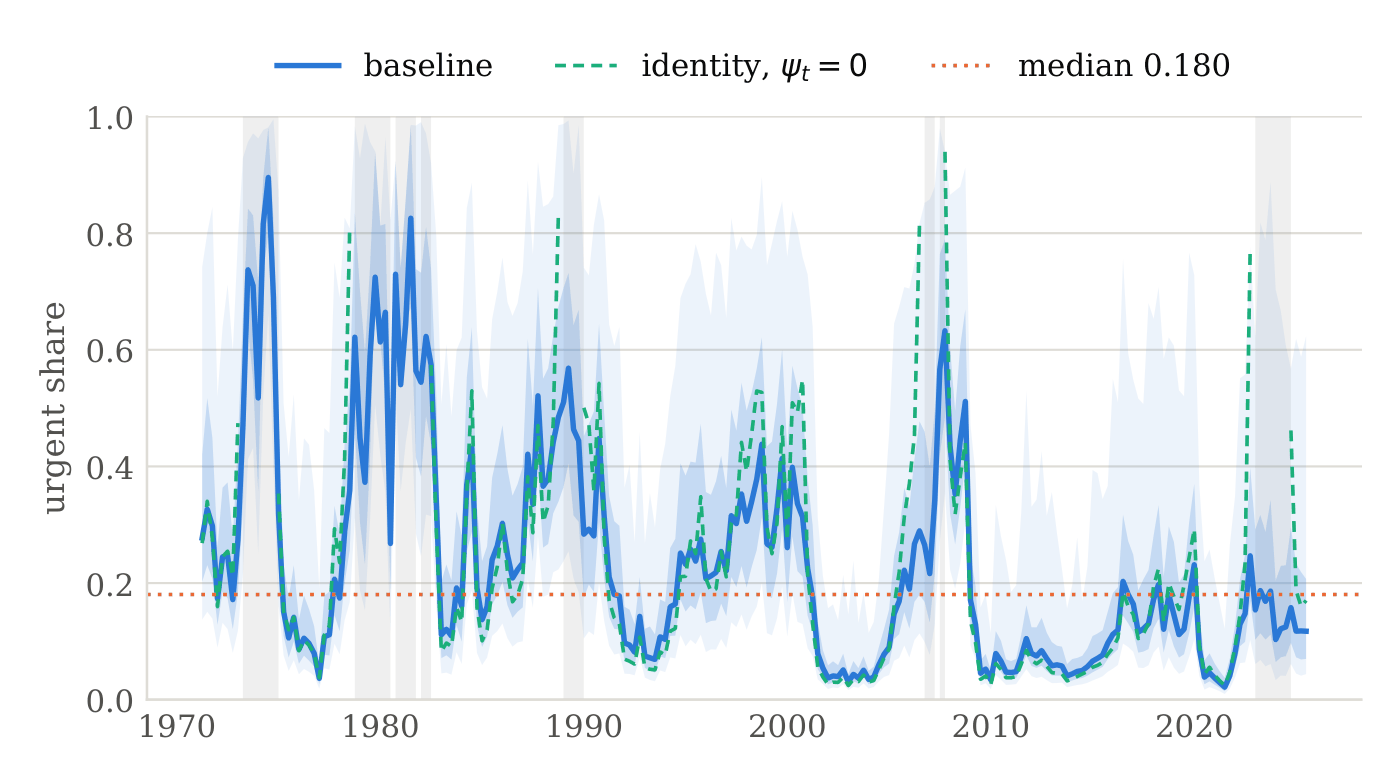
05

Price of Convenience in Money Markets

A monetary asset pricing model estimates the convenience yield of liquidity at 5.1% annually, roughly ten times conventional measures, with only 24% attributable to urgency.

Fanfare 3Derivatives & VolatilityXinhao Dong and Zijian Wang Lucas HerrenbrueckPDF

Urgency share over time showing 24% median contribution to convenience yield.
Figure 3: The composition of convenience: the share of the price of convenience attributable to urgency, ωtℓN
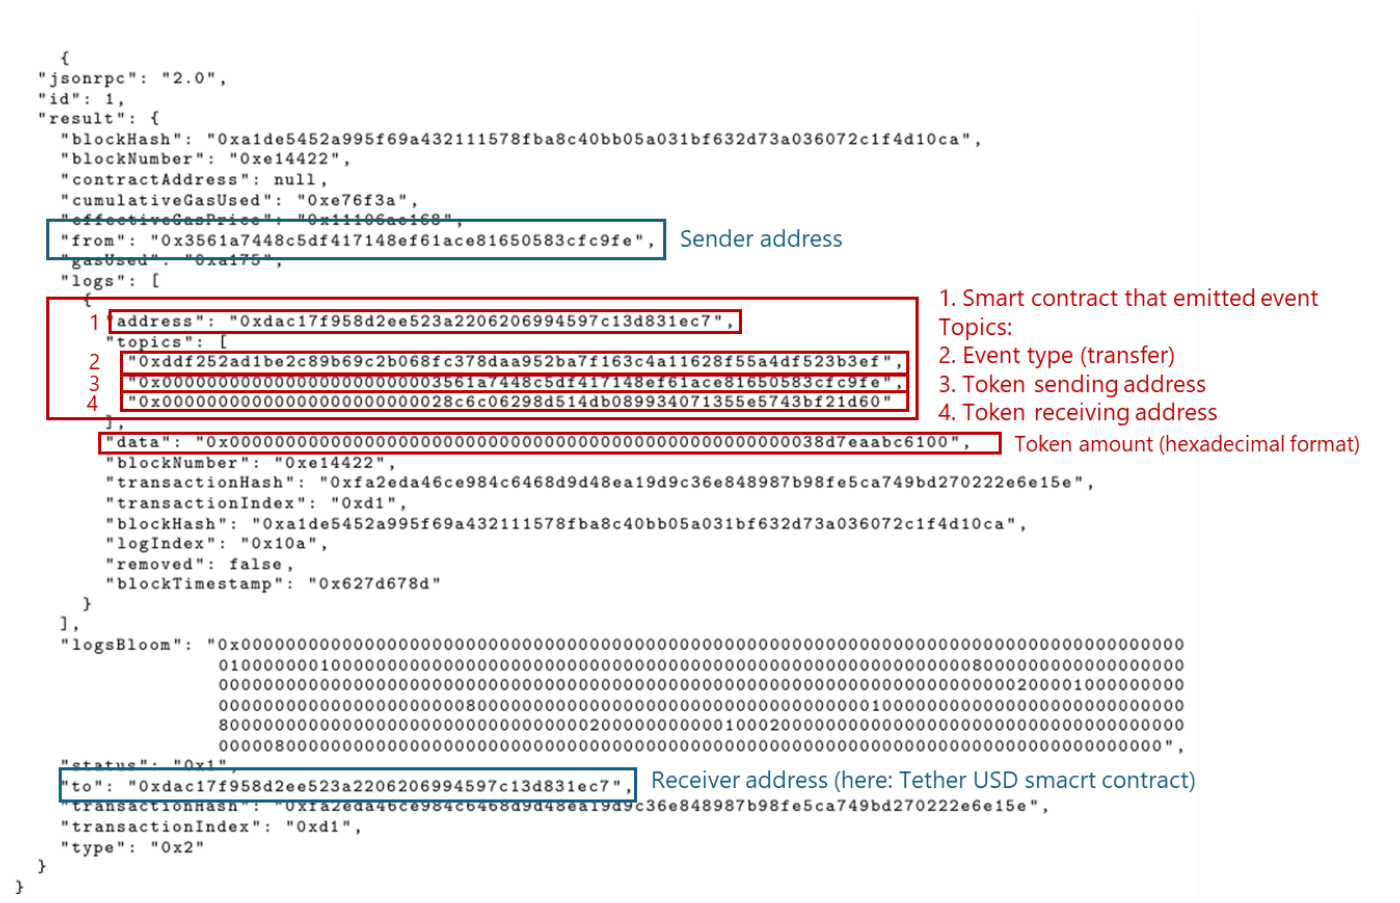
22

Measuring DeFi Ecosystem Activity

The paper identifies three structural sources of measurement divergences in blockchain data and proposes approaches to align technical execution with economic meaning in DeFi ecosystems.

Fanfare 2Crypto & DeFiTimothy Aerts et al.PDF

Example transaction receipt with token transfer
Figure 15: Example transaction receipt with token transfer

Read the paperOpen full-size image

    Type to search. Try rough volatility, LLM agents or FinGPT.

    ↑↓ move↵ openesc closeFull search page